


Client Background
Overview
As a Singapore and Australia based startup, Drive lah (known as Drive mate in Australia) is a peer-to-peer car sharing platform where you can rent a large variety of cars, always nearby at great value. All trips on Drive lah are comprehensively insured through our insurance partners so car owners don’t have to worry about their insurance. The idea is simple: car ownership is expensive in Singapore (per month yet only use the car 5% of the time – cars are mostly parked. With Drive lah you can reduce the cost of ownership by renting it out when you don’t need it in a safe way. Renters can rent those cars when they are not used by their owners at good value.
In a fast-growing non-ownership economy where taxi, food, beauty is available on-demand, Drive lah is envisioning to take the lead in distance travel and simplifying car access
Website
http://www.drivelah.sg
Company size
11-50 employees
Founded
2019
Project Objective
Automating the process to get updated Metrics every week.
Evaluate the following Performance Metrics which will be used on AWS Quick Sight for Performance Evaluations:
- Total Cancellations
- Cancellations by Host
- Weekly Guest Success Rate.
- Monthly Active User’s {MAUs}
- Monthly Active Listings {MALs}
- Total Approved & Live Listings
- Approved & Live InstantBookings
- Approved & Live Dl Go
- Delivery Booking Listings
- Weekly Active Listings {WALs}
- Successful HDM
- Unsuccessful HDM
- Booking Acceptance Rate
- Total Requested Trips
- New Listings Made Live
- Percentage of Live Listings Made Active
- Map Location Metrics Table with Postal Districts.
- DL Live Cars & DL L3M Active Cars
- Host Experience Team Weekly Dashboard
- New Weekly Listings Dashboard
- Two Transaction Metrics
Build Code for extracting Daily Agent Activity Report on Daily Basis.
Our Solution
For Performance Metrics, we suggested that we will Code for each Metric & will store them in a Table on AWS RDS which will be directly synced to the AWS Quick Sight for Performance Evaluations.
For Automating the process to get updated Tables of Metrics every week, we suggested to use a Virtual Machine on which we can upload all code files & can run a Cron Job for each file to automatically get updated on specified time every week.
Tools used
- Jupyter Notebook
- PyCharm
- MySQL Workbench
- AWS Quicksight
Language used
Python
Database Used
Amazon Relational Database Service (RDS)
What are the technical Challenges Faced during Project Execution?
Tried with AWS Lambda Function to update tables on AWS RDS but Lambda Function was unable to run complete code.
How the Technical Challenges Were Solved?
Suggested to use a Virtual Machine on which we can upload our Code Files & can run Cron Job for automatically updating tables on regularly basis.
Project Snapshots
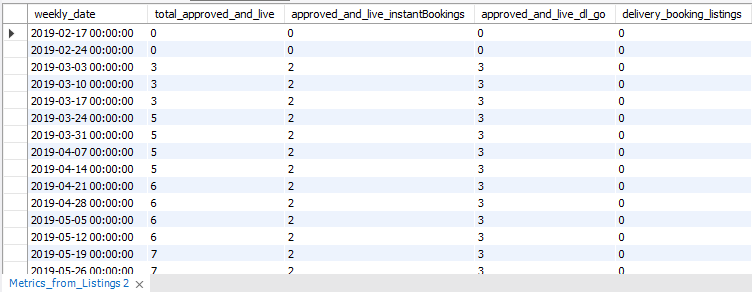
- Metrics from Listings Table:
- Host Experience Metric:

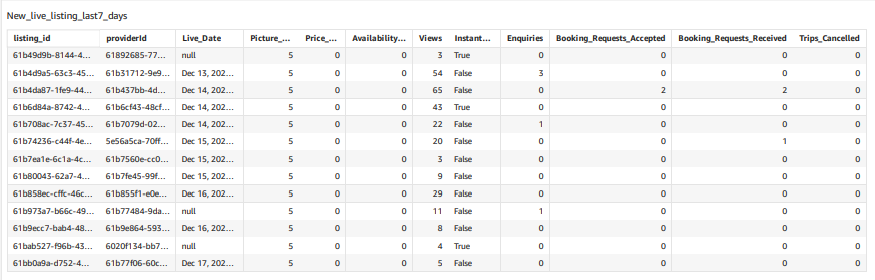
- New Live Listings of Last 7 Days:
- Line Chart of Total Cancellations & Cancellations by Host:

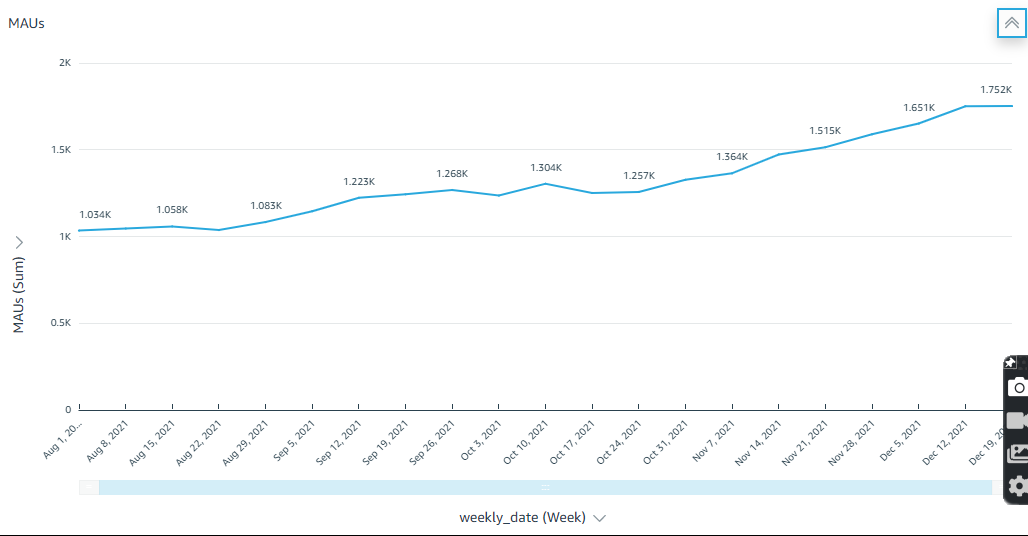
- Line Chart of Monthly Active Users (MAU’s):
- Area Chart of Percentage of Live Listings Made Active:

- Line Chart of Number of DL GO Listings & Number of Instant Booking Listings:

- Line Chart of Monthly Active Listings (MAL’s):

- Line Chart of New Listings Made Live:

- Vertical Bar Chart of Total Approved & Live Listings:


 using Ant Colony System")


