Client Background
Client: A leading tech firm in the USA
Industry Type: IT Services
Services: Consulting, Software, Marketing Solutions
Organization Size: 100+
Project Objective
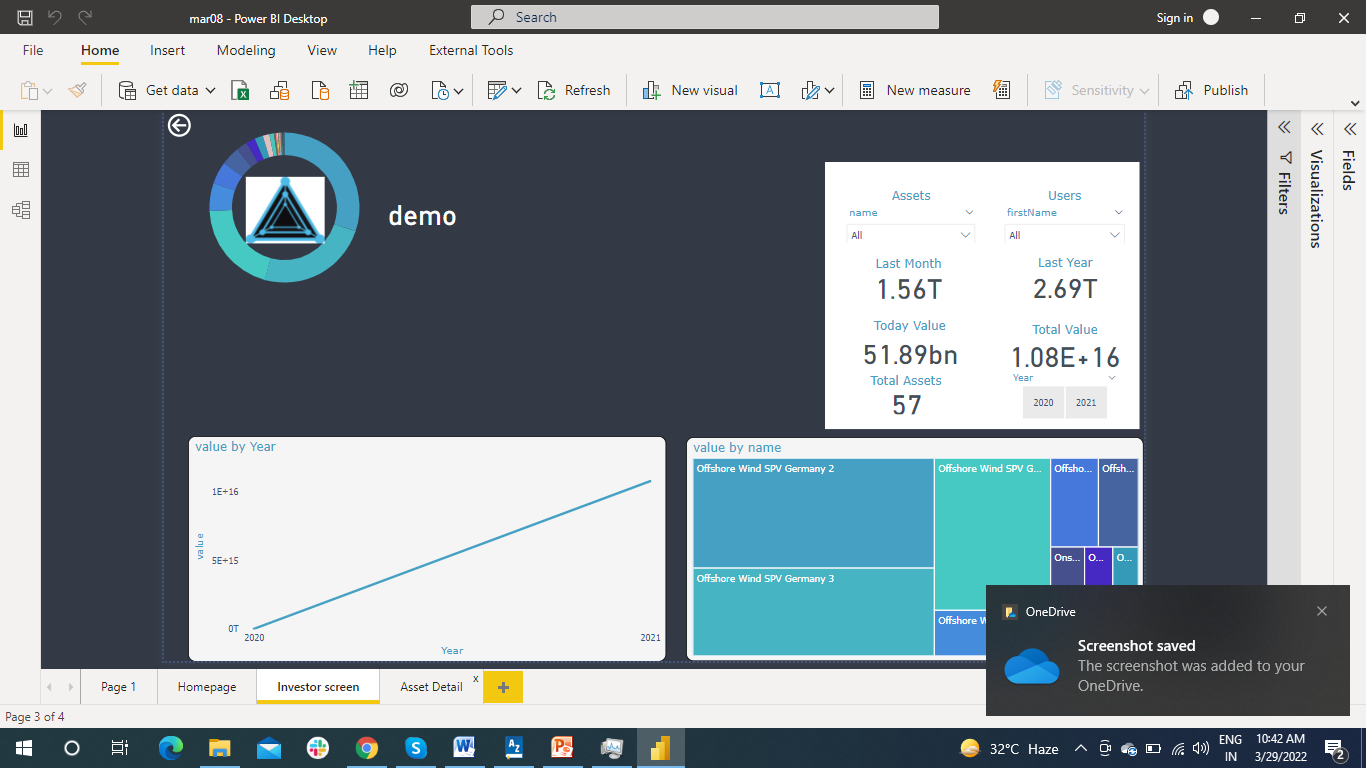
Create a dashboard with Assets Performance With react App. So users can evaluate with Key metrics from data analytics and forecasting.
Project Description
The client requires two pages:
- Screening Asset Performance
- Portfolio Investing according to criteria and sector-based.
Our Solution
- By using Power BI We can achieve this requirement without any additional stack. It requires a subscription to enhance the report.
- Using Page Navigation and bookmarks to create reports like Web Application with React App.
Project Deliverables
Asset Report Page
Investor Page
Tools used
- Power BI
- Azure AAD
- Mongo DB BI Connector
- ODBC Connector
- DAX Studio
Language/techniques used
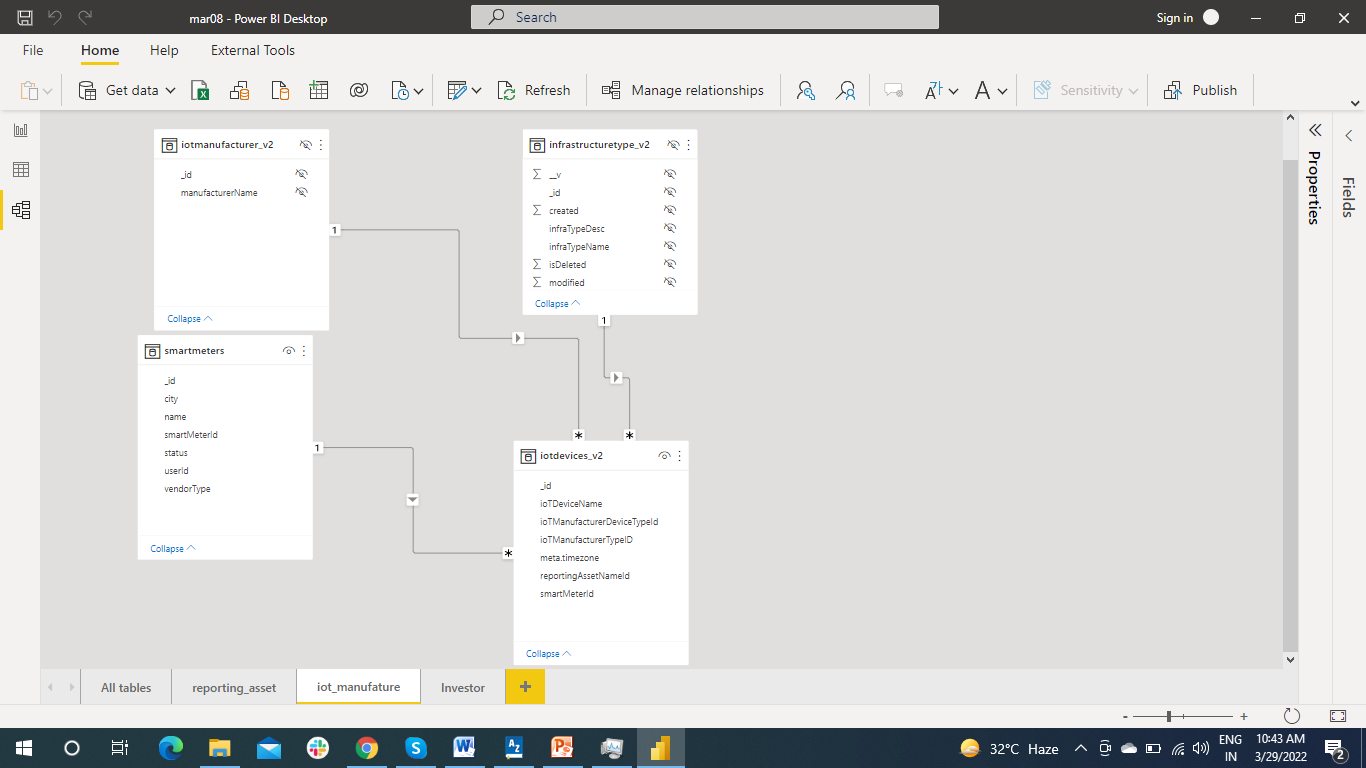
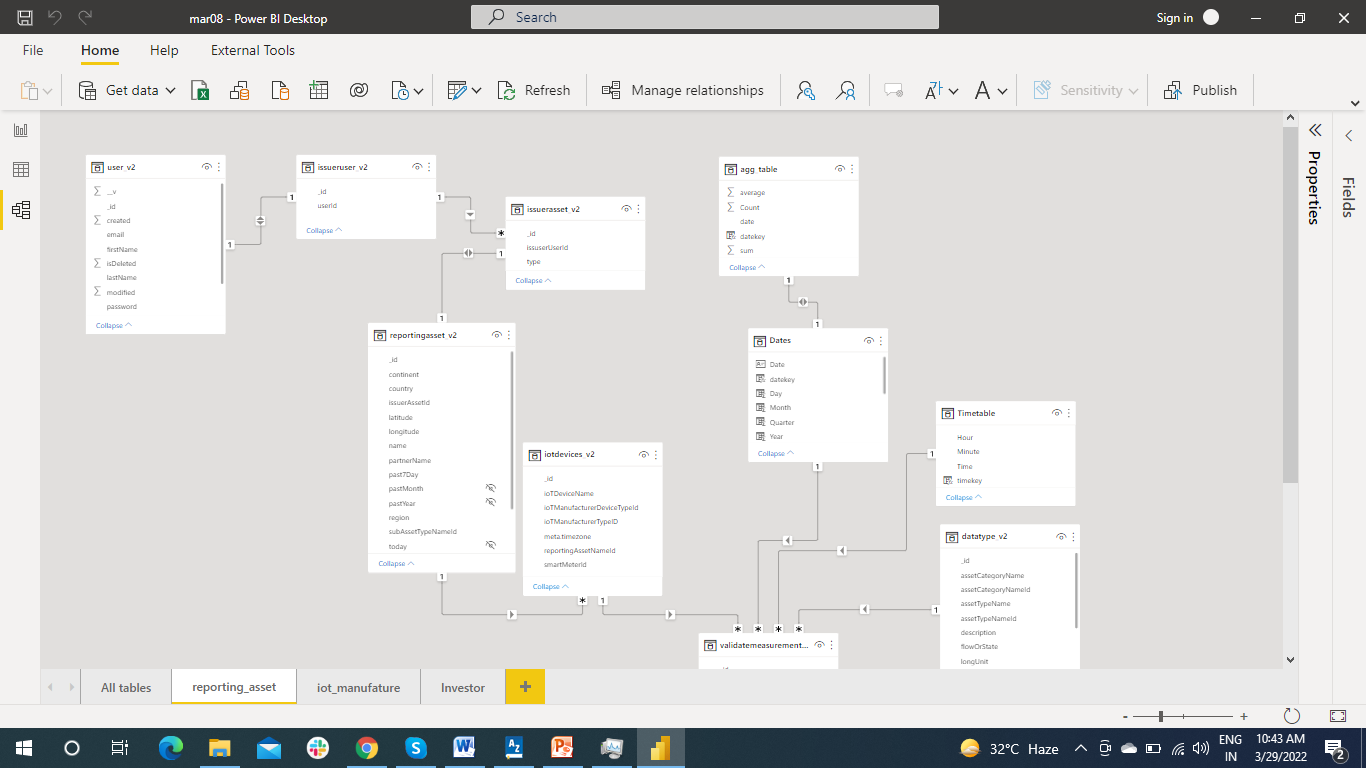
- STAR SCHEMA
Skills used
- DATA MODELLING.
- Performance Analyser.
- Vertipaq Analyser.
Databases used
- Mongo DB
Web Cloud Servers used
- AZURE
What are the technical Challenges Faced during Project Execution
- Time for loading pages is increased due to raw data.
- Cold start of Report taking more time than usual
How the Technical Challenges were Solved
- From Snowflake to Star Schema achieved performance of Report
- By using Performance Analyser debugging resolved many glitches and where it is happening.
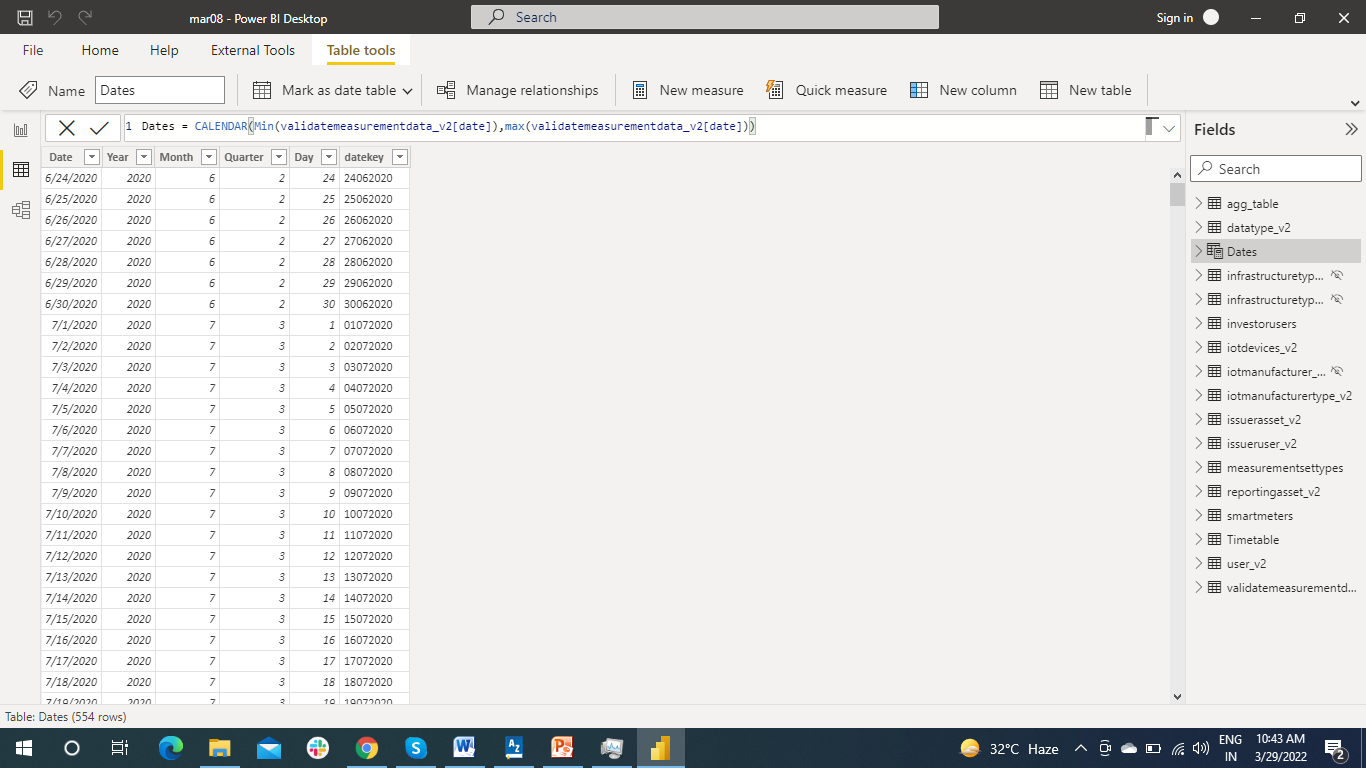
- Extraction, Transformation makes data less complex and removing unwanted data from a website perspective makes data shrink and achieved 75% of Data Reduction.
Business Impact
- Less coding with Power BI speeds the development process and achieves Best UX with less time.
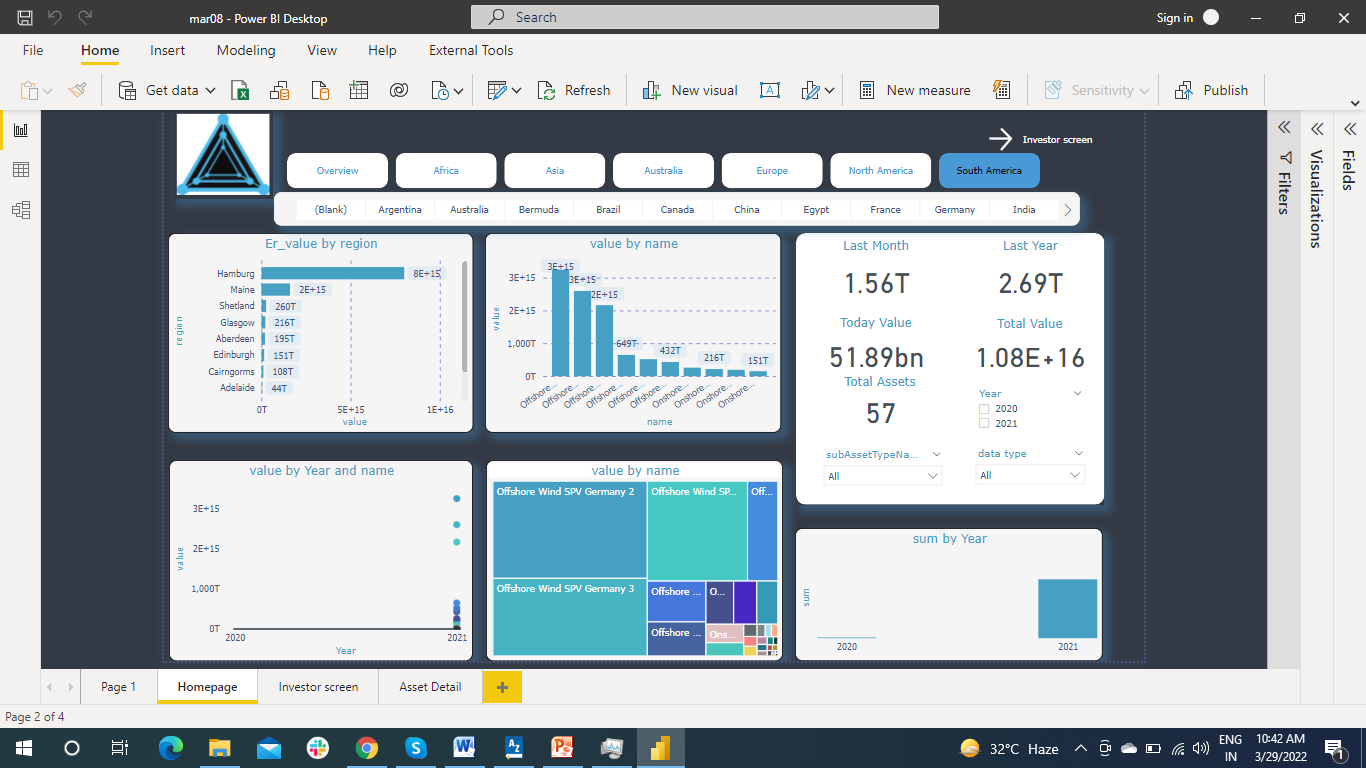
Project Snapshots