


Client Background
Client: A leading tech firm in the USA
Industry Type: IT
Products & Services: IT Consulting, Software Development
Organization Size: 100+
The Problem
The task involves creating an end-to-end data pipeline to extract data from various reports, store it in a Google Cloud Platform (GCP) database, build a dashboard, and develop a machine learning model for price forecasting. The data is pulled from different links, each having a slightly different report layout, with some being in CSV and others in XML format. The goal is to extract data daily and hourly for the past three years. The extracted data is intended to be used for building a dashboard and training/testing a model based on user-defined inputs on the dashboard. The challenge lies in handling the varied formats of the data, ensuring accurate extraction, and maintaining the integrity of the data throughout the pipeline.
Our Solution
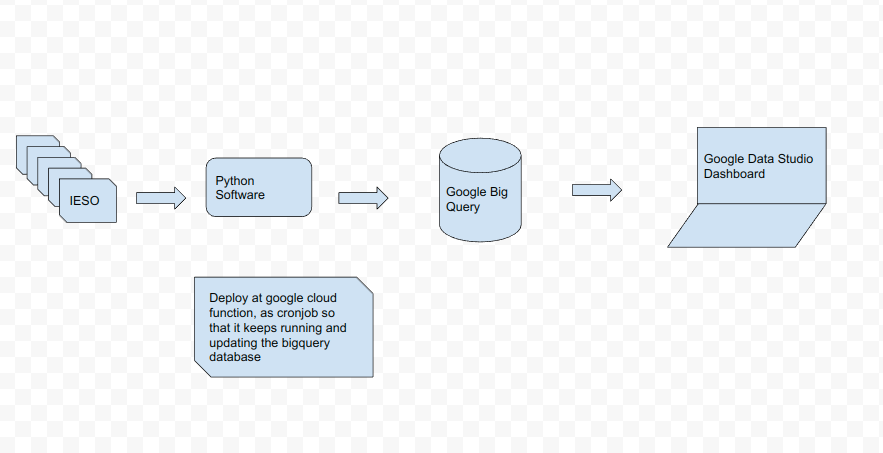
To solve this problem, we will use Python, along with libraries such as pandas and BeautifulSoup, to scrape data from various report links. The scraped data is stored in dataframes and then loaded into Google Cloud Storage buckets. This data is then transferred to BigQuery tables for efficient processing. The data extraction process is automated with a Cronjob/Google Cloud Scheduler.
For the machine learning part, we will build and run various machine learning models in GCP’s BigQuery to predict future fuel/energy prices. We will test LSTM univariate/multivariate, GRU for time series problems, and ANN Regressor, Random Forests regression for regression problems. The ANN regression model will provide the best results for our use case.
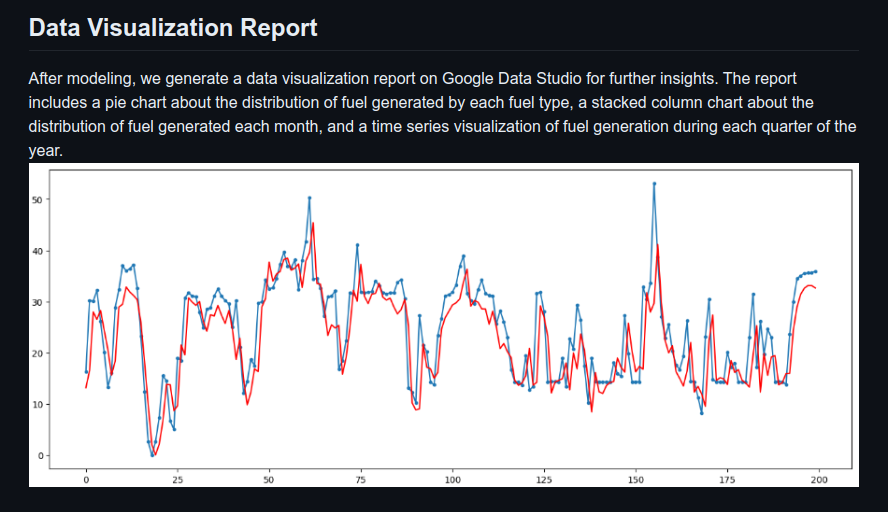
After modeling, we will generate a data visualization report on Google Data Studio for further insights. The report includes a pie chart about the distribution of fuel generated by each fuel type, a stacked column chart about the distribution of fuel generated each month, and a time series visualization of fuel generation during each quarter of the year.
Solution Architecture
Deliverables
- End-to-end data pipeline
- Data stored in Google Cloud Platform (GCP) database
- Dashboard built on Google Data Studio
- Machine learning model for price forecasting
Tech Stack
- Tools used
- Python
- pandas
- BeautifulSoup
- Google Cloud Platform (GCP)
- Google Cloud Storage
- Google BigQuery
- Google Data Studio
- Language/techniques used
- Python
- Models used
- LSTM
- GRU
- ANN Regressor
- Random Forests Regression
- Skills used
- Web Scraping
- Database Management
- Data Visualization
- Machine Learning Model Development
- Databases used
- Google BigQuery
What are the technical Challenges Faced during Project Execution
- Handling varied data formats (CSV, XML)
- Ensuring accurate extraction of data
- Maintaining data integrity throughout the pipeline
How the Technical Challenges were Solved
- Utilizing Python libraries like pandas and BeautifulSoup for web scraping and data manipulation
- Automating the data extraction process using Cronjob/Google Cloud Scheduler
- Testing various machine learning models to select the best fit for our use case
- Using Google Cloud Platform services for storing, processing, and visualizing data.
Business Impact
The successful implementation of the end-to-end data pipeline project had several significant business impacts.
Firstly, it led to improved data quality and accessibility. The project streamlined the process of data extraction from various sources, ensuring that the data was clean, consistent, and readily available for analysis. This resulted in more reliable and accurate predictions, leading to better decision-making and strategic planning.
Secondly, the project enhanced operational efficiency. By automating the data extraction process with a Cronjob/Google Cloud Scheduler, the team saved considerable time and effort. This allowed the team to focus on more strategic tasks, thereby increasing productivity.
Thirdly, the project facilitated informed decision-making. The dashboard built on Google Data Studio provided users with real-time insights into fuel consumption patterns and energy prices. This helped stakeholders make informed decisions regarding energy usage and pricing strategies.
Lastly, the project demonstrated the company’s commitment to leveraging advanced technologies for business growth. The use of Google Cloud Platform, BigQuery, and Google Data Studio showcased the company’s ability to innovate and stay competitive in the rapidly evolving digital landscape.
Overall, the project had a positive impact on the company’s operations, decision-making processes, and reputation among stakeholders. It underscored the importance of data-driven decision making and highlighted the potential benefits of investing in advanced technologies.
Project Snapshots
Project website url
https://console.cloud.google.com/compute/instances?authuser=1&project=ieso&pli=1
Summarize
Summarized: https://blackcoffer.com/
This project was done by the Blackcoffer Team, a Global IT Consulting firm.
Contact Details
This solution was designed and developed by Blackcoffer Team
Here are my contact details:
Firm Name: Blackcoffer Pvt. Ltd.
Firm Website: www.blackcoffer.com
Firm Address: 4/2, E-Extension, Shaym Vihar Phase 1, New Delhi 110043
Email: ajay@blackcoffer.com
Skype: asbidyarthy
WhatsApp: +91 9717367468
Telegram: @asbidyarthy


