


Client Background
Client: A leading tech firm in the USA
Industry Type: IT
Services: SaaS, Products, healthcare, government, energy
Organization Size: 100+
The Problem
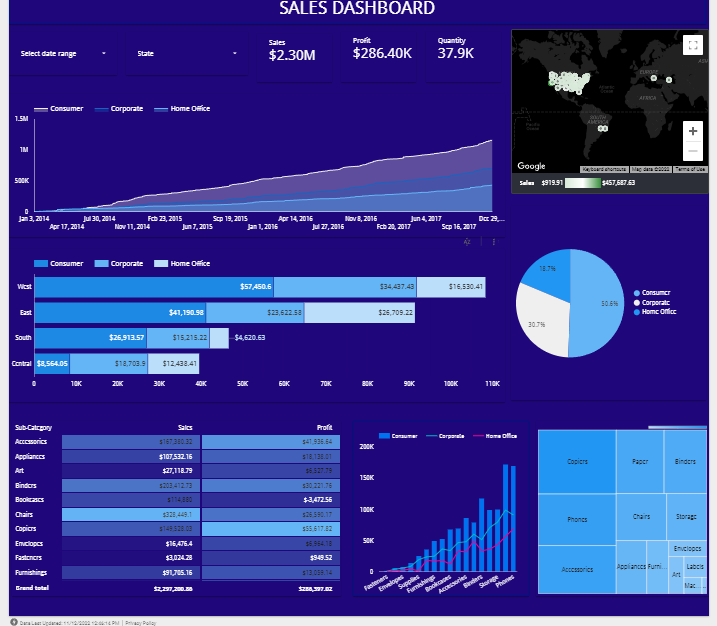
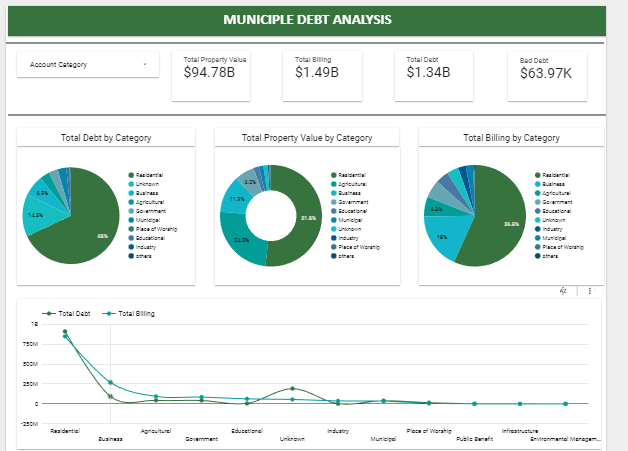
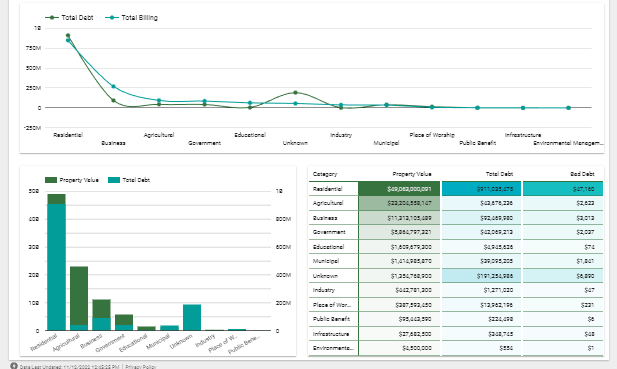
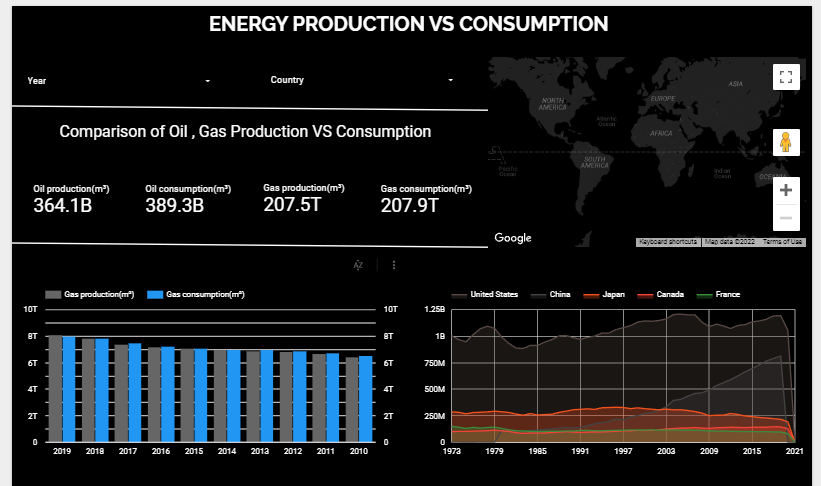
Our client needed a Google Data Studio dashboard for different sectors such as Oil and Gas, Government, Healthcare, and Sales analysis. They want to see an analysis of data from which they can provide insights in different domains. They want us to create visual KPIs of meaningful insights.
Our Solution
They provided us with data for different sectors. Using those data first we analyze the data and perform EDA on data for cleaning the data. After cleaning the data, we performed calculations to extract insights for KPIs. Using those KPIs we build a dashboard on Oil and Gas, Government, Healthcare, and Sales analysis.
Solution Architecture
To build the dashboard we follow the pipeline as follows:
Data 🡪 EDA(Cleaning data )🡪 Connection(GDS) 🡪 Building KPIs(Visuals)
Tools used
Google Data Studio
Skills used
EDA, Google data studio
What are the technical Challenges Faced during Project Execution
During the project execution, we faced the following challenges:
- The data client provided was not cleaned.
- Data was of four different sector which we have to analyse and visualize.
- Extracting insights from data.
How the Technical Challenges were Solved
To solve the technical challenges, we provided following solutions as follow:
- Performed EDA on data to clean it and find the missing values.
- As data was from different domains, we have analysed each sector and understand the culture of each domain. We understand the pipeline and flow of work process.
- After completing the case study, we use calculations to extract the meaningful insights from data.
Business Impact
Using these dashboards client can visualize the sales insights and understand the workflow. They can take crucial decisions based on these insights which will help them to make an impact on their sales.
Project Snapshots
Sales Dashboard:

Government Dashboard:
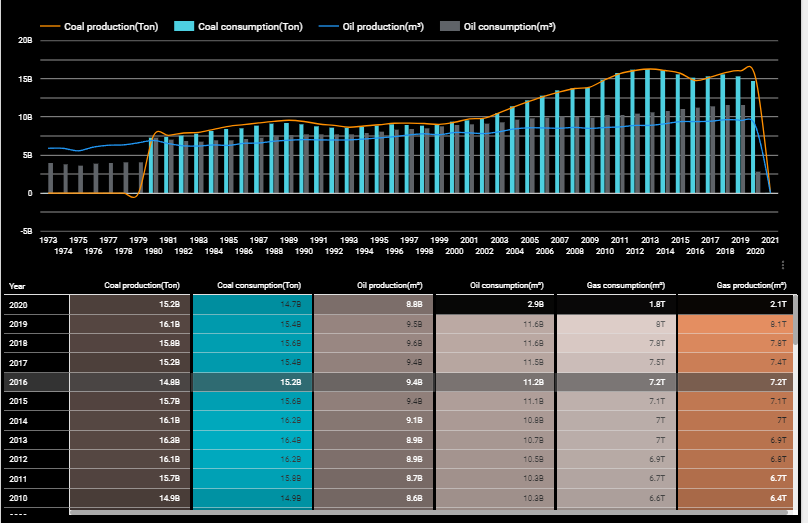
Oil and Gas Dashboard:
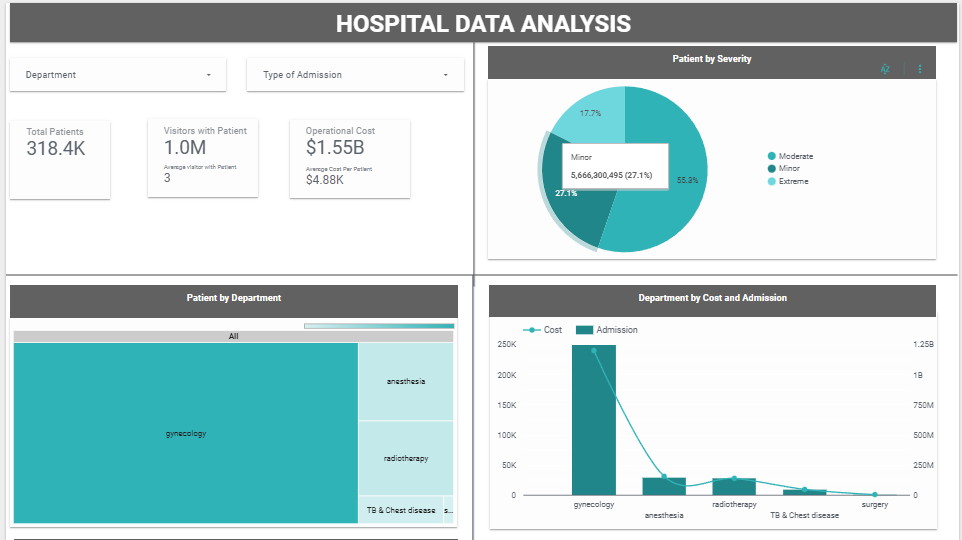
Hospital Analysis:

Project website url
Dashboards on Google Data Studio:
1.Government:- https://datastudio.google.com/reporting/dda94ce8-5b77-46aa-a1e0-1a57ccaef5f9
2.Oil:- https://datastudio.google.com/reporting/47c6529e-1355-4072-babf-1a96f9f842cf
3.Healthcare:- https://datastudio.google.com/reporting/b1e95a11-4380-465c-ad45-2d1995c799fb
4.Sales:- https://datastudio.google.com/reporting/36ec0e42-6b77-4fbb-9dea-760cccaa741f
Project Video
Contact Details
Here are my contact details:
Email: ajay@blackcoffer.com
Skype: asbidyarthy
WhatsApp: +91 9717367468
Telegram: @asbidyarthy
For project discussions and daily updates, would you like to use Slack, Skype, Telegram, or Whatsapp? Please recommend, what would work best for you.


