


Client Background
Client: A leading marketing firm in the USA
Industry Type: Marketing services & Consulting
Services: Marketing consultant
Organization Size: 100+
Project Objective
Project ‘Population and Community Survey of America’ objective were to perform Data Abstraction, Data Structurization, Data Preprocessing, Data Cleaning, and Combining Data from all the years listed and finally presenting insights of the data by Exploratory Data Analysis.
Project Description
For Project ‘Population and Community Survey of America’ task involved fetching json and unformatted csv data from numerous web links further needed to process data, handling nested JSON, data conversion of JSON data in dataframe, performing certain pandas operation for feature selection and structuring data. Concat all this data into one csv file then handle missing value by mapping with another dataset finally perform certain data visualization and exploratory data analysis.
Our Solution
Module 1: Data Abstraction
The process of data abstraction involves collecting data from numerous web links from Year 2005 to 2017 and viewing the data using JSON viewer in tree format.
Module 2: Data Chunking and Integration
Was unable to process data in pandas so performed data chunking with chunksize 10000 rows at a time for year 2005 likewise performed for all other years data till 2017 and finally combined all the dataframes into one containing all data from year 2005 to 2017.
Module 3: Handling Complexity of Nested Data & format the Unformatted CSV Files
Handling unformatted CSV in proper comma separated format so that data frame can be formed. Dataframe produced after merging for all the years from 2005 to 2017 contains a lot of nested JSON data among certain attributes so performed normalization of nested Json forming new_columns naming them based on their attributes key.
2.2.4 Module 4: Data Cleaning and Preprocessing
Involves handling missing value, contraction mapping with another dataset to fill the missing State_Zip_Code column, handling inf and -inf within the dataset for some attributes and forming a new column population_ratio based on passing formula among other attributes.
2.2.5 Module 5: Data Analysis
This step involves forming a correlation matrix to understand the relation between numeric attributes. performed Exploratory Data Analysis on strong correlated attributes to understand pattern/relation between them.
Project Deliverables
After completion of Project we provided:
- Final Preprocessed CSV Files
- Three iPython files:
- Preprocessed dataset from year 2010 to 2015
- Preprocessed dataset from year 2008 to 2017
- Data Visualization and EDA.
Tools used
● Jupyter Notebook
● Anaconda
● Notepad++
● Sublime Text
● Brackets
● Python 3.4
● JSON Viewer
Language/techniques used
● Python
● ETL Techniques
● Advanced Excel Formatting
Models used
My project ‘Population and Community Survey of America’ developed with a software model which makes the project high quality, reliable and cost effective.
● Software Model : RAD(Rapid Application Development model) Model
● This Project follows a RAD Model as our model is not forming the loop from end to the start, also my project was based on prototyping without any specific planning. In the RAD model, there is less attention paid to the planning and more priority is given to the development tasks. It targets developing software in a short span of time.
● Advantages of RAD Model:
o Changing requirements can be accommodated.
o Progress can be measured.
o Iteration time can be short with use of powerful RAD tools.
o Productivity with fewer people in a short time.
o Reduced development time.
o Increases reusability of components.
o Quick initial reviews occur.
o Encourages customer feedback.
o Integration from very beginning solves a lot of integration issues
Skills used
- Pandas Operations
- Data Chunking and Integration
- Data Visualization
- Exploratory Data Analysis
Databases used
No Database is used in this project, only used Google Drive for Storing and Transferring Data.
Web Cloud Servers used
No Web Server is Used
What are the technical Challenges Faced during Project Execution
Data Cleaning and Filling out Missing Values by Data mapping with another dataset as the Data was not in proper format in the another dataset.
How the Technical Challenges were Solved
Data Cleaning was done using a few built in pandas operations to deal with Missing Values, Ordering Data Columns, Data Formatting, Changing of data types and many more. Filling of remaining Missing Data from columns using Outer Join among the datasets and using Map Function of Python.
Project Snapshots
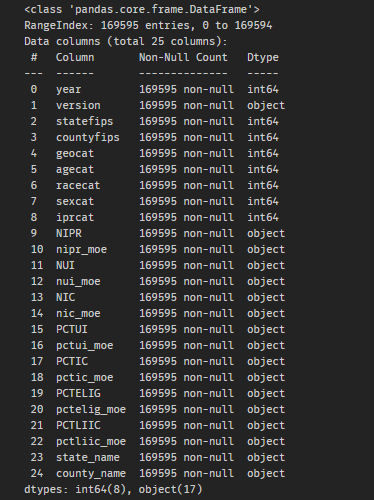
Figure 1: Input Data Schema for Year 2008

Figure 2: Output Data Schema from Year 2005 to 2017

Figure 3: Dataset for Year 2008
figure 3 is pandas dataset of year 2008 which has 169595 rows and 25 columns which was fetched from authenticated survey web portal, data obtained were in JSON format which were converted into pandas dataframe likewise there are dataframes created from year 2005 to 2017.

Figure 4: Output Preprocessed Dataset
figure 4 is an output preprocessed dataset from 2005 to 2017 which has 26,41,363 rows and 25 columns.
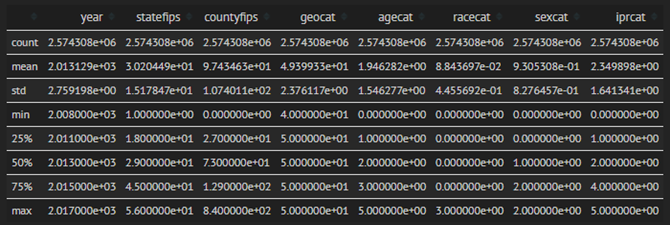
Figure 5: Describing Numeric Data of Preprocessed Dataset
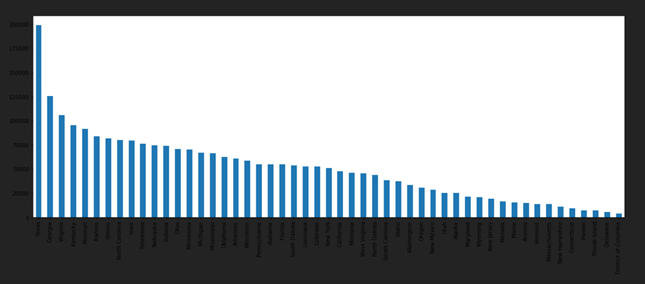
Figure 6: Bar plot of attribute state_name
figure 6 represents the bar plot among the state_name on the final output dataset from year 2005 till 2017.

Figure 7: KDE Graph for all numeric population data column of dataset
figure 7 represents the Kernel Density Estimate Plot(KDE) among all Population estimate data columns for the Preprocessed Dataset. KDE plot is a method for visualizing the distribution of observations in a dataset, analogous to a histogram. KDE represents the data using a continuous probability density curve in one or more dimensions. Plotted many more graphs apart this between highly correlated attributes like pair plot, box plot, line plot etc.

Figure 8: Flow Chart


 – ETL tools and Dashboards")


, and ETL tool")