


Client Background
Client: A leading healthcare tech firm in the USA
Industry Type: Healthcare Consulting
Services: Management consultant
Organization Size: 100+
Project Objective
The main objective of this project is to find the pattern in the vital signs of patients who were admitted to the hospital in past. And from this pattern, we get some ranges that help us to give early warnings.
Project Description
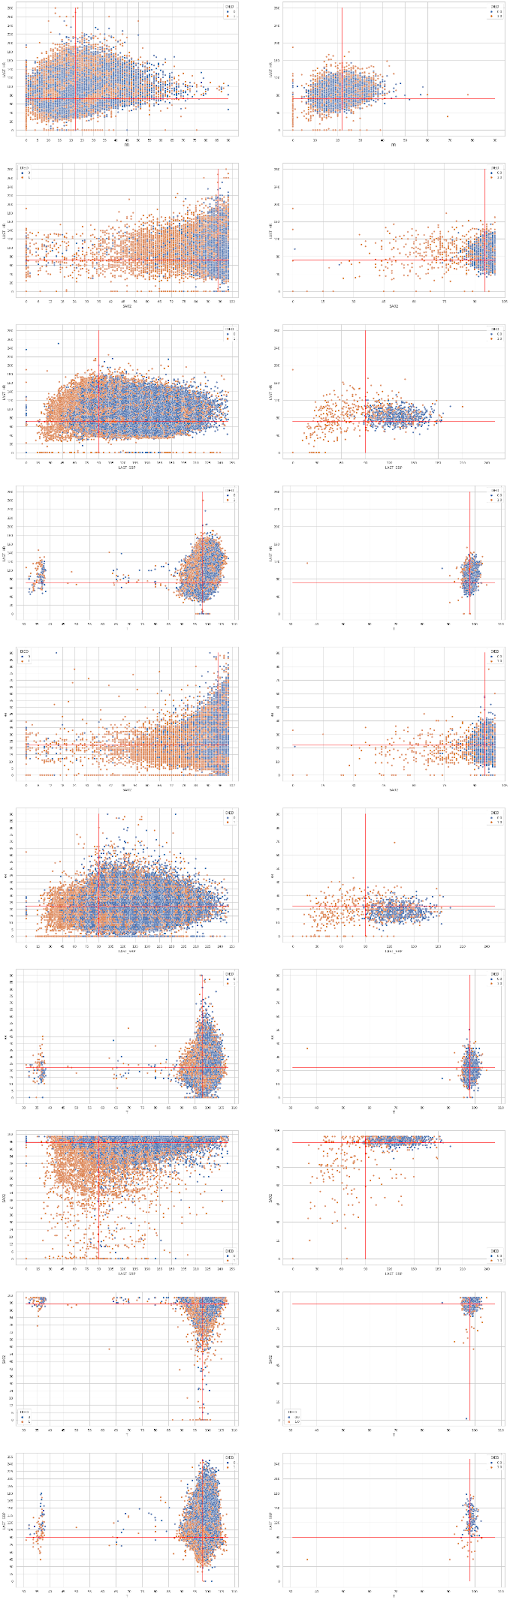
We are more interested in non-survivor patients’ vital signs as compare to survivor patients. we find patterns in vital signs that could better determine that patient died (ex. if Sp02 is below 70, patient in 95% of cases died, if Sp02 is below 50%, the death rate is 99.9%) or we can take correlations which can help us to find better patterns to define death cases.
Data The dataset which was used for analysis here is taken from the mimic website. But the dataset is not in the correct format which we want, after some manipulation, we get the data ready for the analysis.
Our Solution
Approach
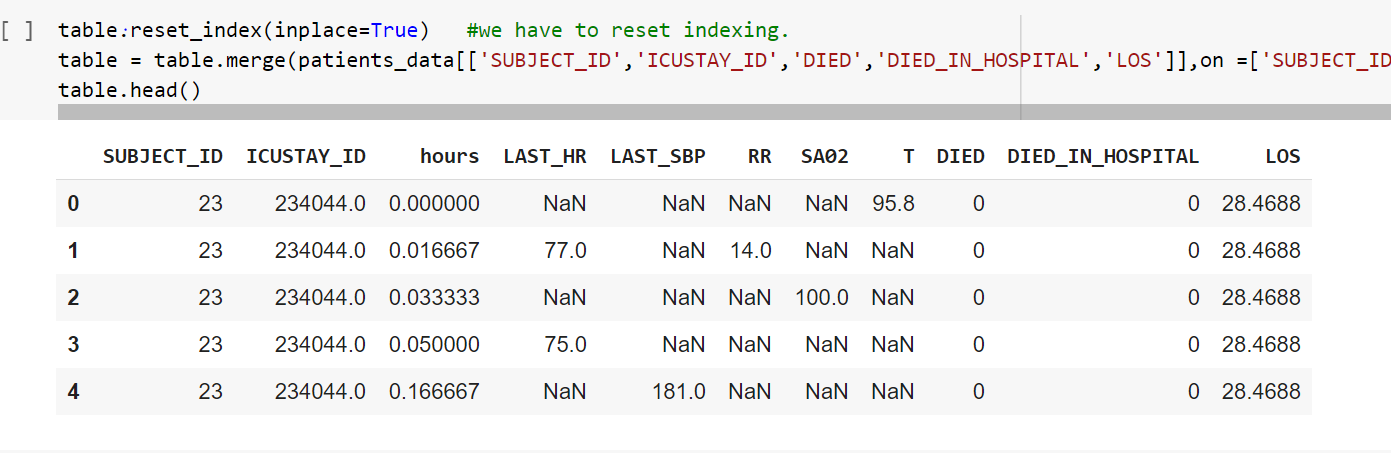
- To protect patient confidentiality date and time is shifted to future that’s not the actual time so from shifted time column we create an extra column hour which tells us the time passed in hours since first observation in ICU.
- After all manipulation our final dataset contain vital signs values for each observation of patients with time in separate column and also the label fo Death (0 or 1) in another column.
- There are two options to deal with missing values
- Drop all rows which contain null values.
- 2.Fill the missing values by some method using pandas.
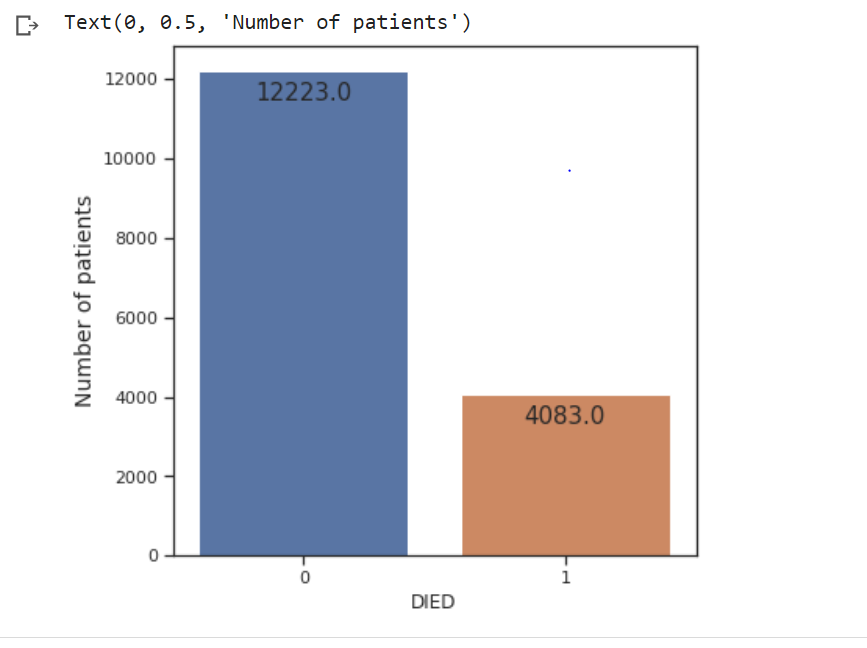
I can’t go with 1st option because a major part of the data has missing values. so, I decided to go with the second option and fill missing values with the average of upper and lower values. But before that, I filtered the data and take only those patients’ data who died in a hospital or survive.
Project Deliverables
- After performing EDA which also include the removal of some impossible outliers, we come up with a result of Analysis.
- This result helps to build an early warning system which predict the condition of patients on the basis of their score, calculated on their condition using vital sign values.
Tools used
- Google Colab Notebook
Language/techniques used
- Python
Skills used
- Data visualization
- Data analysis
- Pandas
- Numpy
- Seaborn
Databases used
SQL
MongoDB
Web Cloud Servers used
Google Cloud
Project Snapshots


Project website url
https://colab.research.google.com/drive/1mo7i32BoEVb0Ac6_CWwJd7_HVbliktx0?usp=sharing


")


