


RFM Model for Data Analytics Solution
RFM stands for “Recency, Frequency, and Monetary” and is a way to figure out who your most valuable customers are. RFM is based on the Pareto Principle (the 80/20 rule) which tells us that 80% of the income comes from 20% of customers. We can use RFM to identify the top 20% of customers and focus our marketing on that market segment.
Recency: When was the last time the customer made a purchase? Customers who purchased from you recently are more likely to buy from you again than customers from the distant past.
Frequency: how often does the customer spend money? A customer who is more frequent is much more likely to buy again than someone who only comes in once a year.
Monetary: how much did the customer spend? A customer segment that makes a large purchase brings more revenue to the business.
Customer segmentation is often performed using unsupervised, clustering techniques (e.g., k-means, latent class analysis, hierarchical clustering, etc.), but customer segmentation results tend to be most actionable for a business when the segments can be linked to something concrete.
We can give labels to our customer segments obtained from statistical segmentation that we can call “Managerial Segments”
Building the RFM Model from the variables in Room Bookings and Guests Checked-in files
Variables Required
1. Check-out: This variable will be used to calculate the recency i.e. when was the last time the customer visited.
2. Stay Count: This variable is used to calculate the frequency of customer visits.
3. Total: This variable will give us the idea of customer spending whether the customer falls in the bracket of a high spender or a low spender.
On the basis of data on the above variables, we can develop clusters of customers and label them to implement a marketing plan for different segments.
Let’s look at an example of how the clusters may look like and how they can be labeled
After applying the RFM model on the data, we can have the three variables – Recency, Frequency, and Monetary value as shown in the following table
The segmentation can now be done in the RFM model using clustering technique shown in the table below
| Group | Recency | Frequency | Monetary |
| 1 | 1528.18 | 1.91 | 41.70 |
| 2 | 2845.97 | 1.33 | 37.26 |
| 3 | 315.31 | 8.99 | 62.78 |
| 4 | 324.33 | 2.12 | 52.65 |
| 5 | 1016.39 | 2.39 | 1572.20 |
We can see 5 clusters in the above data. Some important characteristics of clusters that can be recognized are summed up below
Group 3 and Group 4 contain the customers who are more recent and are likely to continue doing business with the company in the future while Group 2 contains the customers who have churned probably and moved on to the competition.
Group 3 are the most frequent customers and can be considered loyal to the company. Special attention should be given to these customers in order to retain them.
Adding labels to the segments
Segmenting groups are dynamic and should be carried out with some rules put in place by the company on when a segmentation process should be performed and the segments are updated. Adding labels to the clusters also helps in designing marketing plans like designing promotions, sending newsletters to a particular segment.
What type of customers should receive more?
Coupons Phone Calls
Emails Direct mail solicitations
Depends on:
Who the customers are?
How much they spend? (Monetary value)
And how much will they buy in the future? (Depends on if they have spent recently: – Recency)
We can look at the following labels to get an idea of managerial segmentation

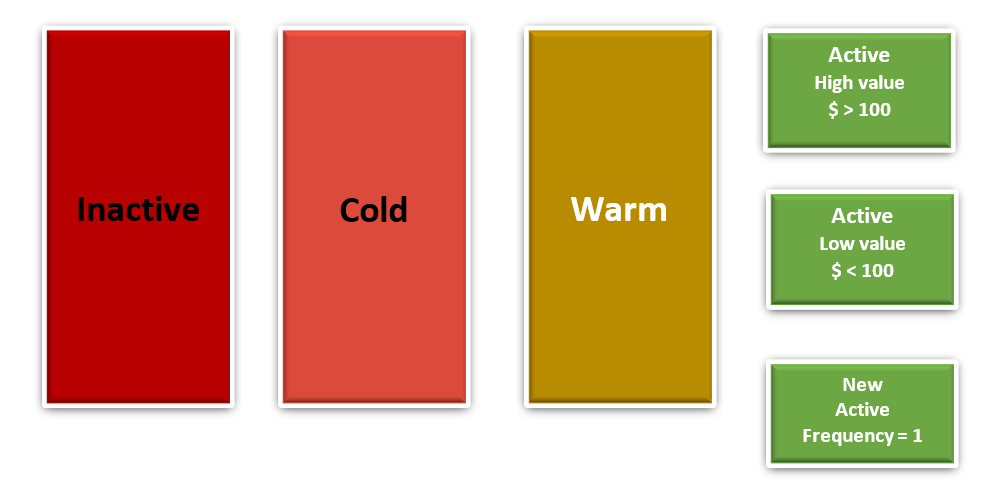
The new active customers who have transacted only once with the company can be sent promotional offers. To retain them and increase their frequency in the future.
Findings for Data Analytics Solution
- RFM model can be built for corporates and customers separately
- For designing commercials, we need to identify the characteristics of customers and segment them into business travelers, leisure travelers, budget travelers. Travelers can be part of multiple groups like luxury – leisure travelers, luxury – business travelers, etc.
- Variables like (Booked by, Property name) can be used to identify the type of customer
- (Tag) – Identifying the booking platform used by the customer
- The occupancy over the year can be analyzed to determine the highest and lowest occupancy rate during the year


")

 or Firebase to Google Data Studio Mobile App KPI Dashboard")
