


Client Background
Client: A leading EduTech firm in the USA
Industry Type: EduTech
Services: Educations. Training
Organization Size: 1000+
Project Objective
- Confirmation / Identification of data that can be used / obtained without bias.
- Understanding the Actions that are required to be performed post analytics.
- Converting the data into metrics using formulae that can be used to conduct the analysis.
Project Description
It is a culture management platform that uses learning as the fundamental mode of communication. The platform requires an Analytics portion that captures a variety of data related to the interaction of the learner with content, assessments, engagements and forums to create personalized learning plans for each user to increase the effectiveness of learning and its retention which together make an impact on the overall productivity of the learner and the organization.
Our Solution
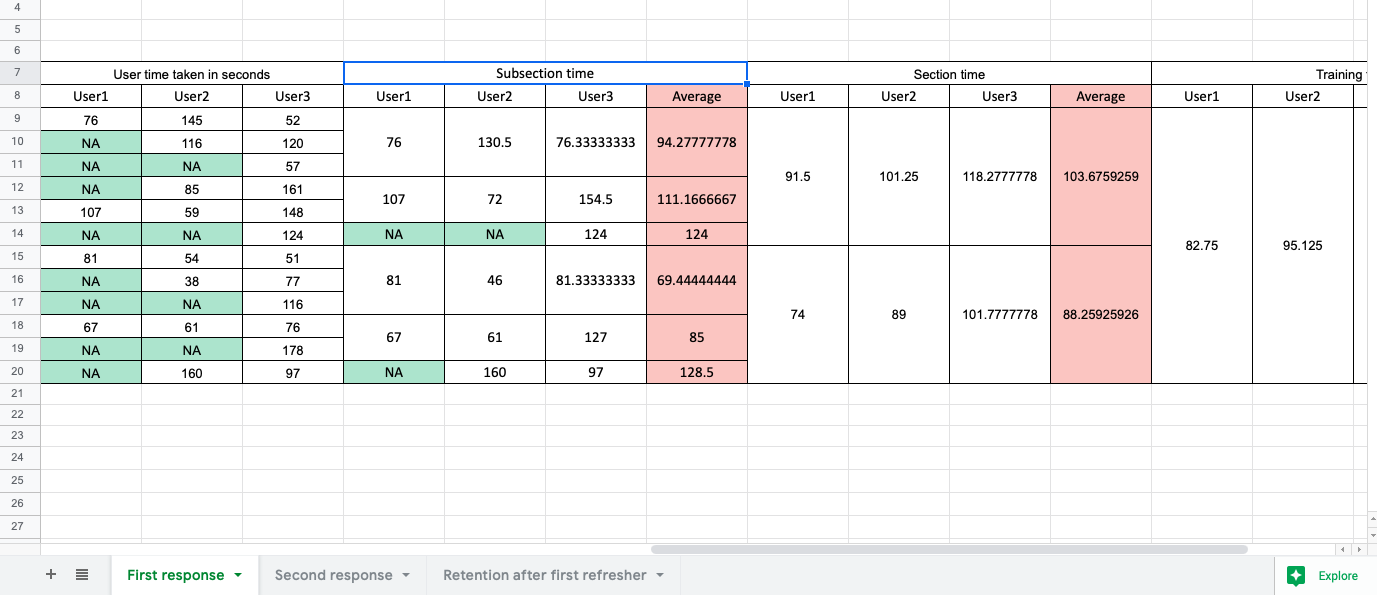
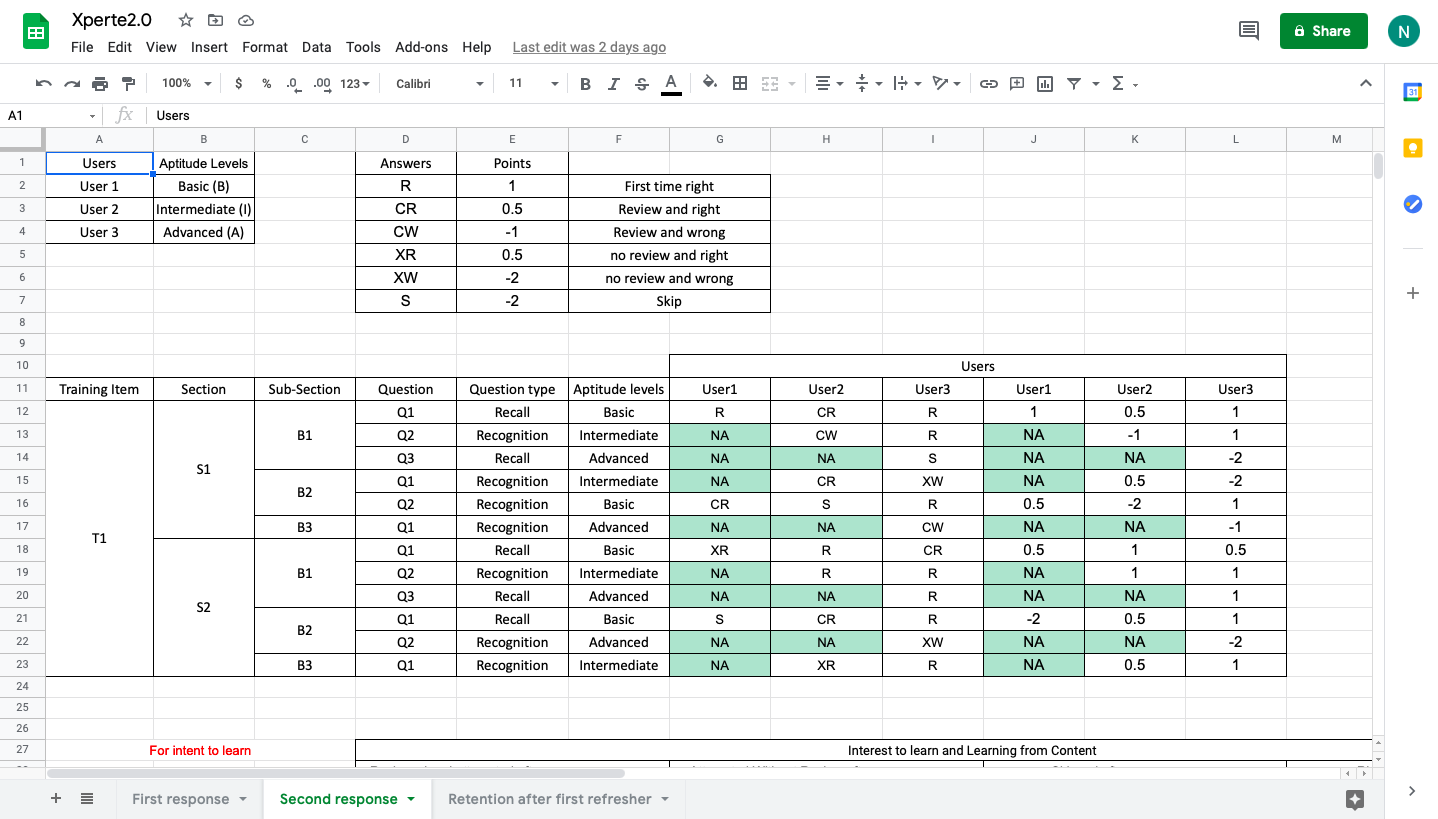
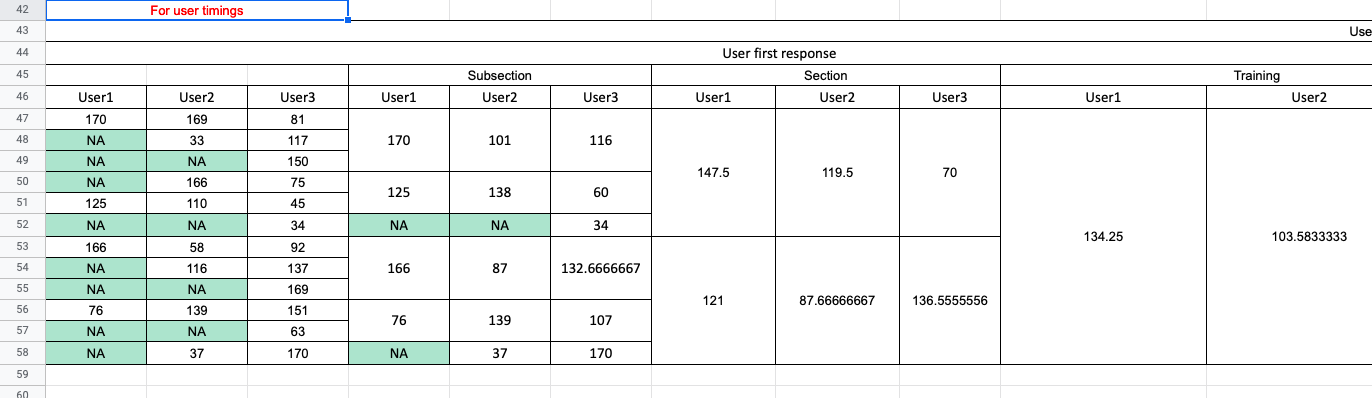
We helped the client in deciding the data required for the analysis process. We came up with the appropriate models for various tasks and interpretations of how the data will be collected and analysed for the initial response, final response, retention, proficiency, and learning intent of the user. We designed the models in such a way that one can perform seamlessly grading for each question type (based on difficulty level) and at a different hierarchical level (sub-section, section, training, and so on). We knew that each user has its unique aptitude level (basic, intermediate, and advanced) and keeping that in my mind, we incorporated those aptitude levels in our analytics too. Moreover, we integrated the grade and time factor into the analysis so that more points are allotted for comparatively tough questions and quick responses, respectively.
Project Deliverables
MS Excel sheet, Google spreadsheets with proper tables and visualizations.
Tools used
Jupyter notebook, MS Excel, Google Spreadsheets.
Language/techniques used
Python.
Skills used
Data science and analytics.
Databases used
Generated our data through data simulation.
What are the technical Challenges Faced during Project Execution?
Data analytics is all about analysing and finding patterns in the data that already exist or are getting generated in real-time. However, this project is in the budding stage, and we had no data to start our analysis. Moreover, this project is novel, and the dataset that meets our requirements was nearly impossible to find online.
How the Technical Challenges were Solved
We performed data simulation techniques and tried to generate the data as authentic as possible using some libraries in python and random functions in spreadsheets. We also generated the data manually at a small scale, but we made sure that we are including every human factor in it.
Project Snapshots (Minimum 10 Pictures)


")


