


Client Background
Client: A leading marketing firm in the USA
Industry Type: Marketing
Services: Consulting, Software, Marketing Solutions
Organization Size: 400+
Project Objective
The project objectives are as follows:
- Assisting the businesses with the setup for Google Analytics, Google Tag Manager which helps them in tracking the analytics of the website.
- Setup pixels of Social Media platforms like LinkedIn and Facebook which assists users in tracking conversions.
- Providing monthly insights on their website performance to analyse the businesses’ strengths and opportunities for growth.
Project Description
This project includes assisting businesses with digital analysis for their marketing.Digital analytics allows you to stand back, get the big picture, and see what is working and what isn’t in your overall strategy so you can adjust. The importance of digital analytics is that it allows for a data-driven approach to marketing, and as such it can produce better results.
The primary objective of the project is to help the businesses in knowing their target audience, understanding the trends in digital marketing, and providing insights on the analytics part of their website performance. Use the digital analytical data to determine if your business’ aims are in line with the customer’s wants and needs. As the picture of the customer’s needs unfolds, adjust the objectives accordingly.
Our Solution
The main aim of this project is to assist the businesses to improve their website performance with the use of technologies like Google Analytics, Google Tag Manager and dashboards built on Whatagraph.
Google Analytics:
Google Analytics is integral to tracking and measuring data from a number of digital platforms, but especially web metrics and customer behaviour. For example, through Google Analytics, you can see when people drop out of the buying process, perhaps they abandon while on the cart page, which would then inform your decisions on how to improve the check-out process.
Because Google Analytics measures traffic from a variety of devices and sources and integrates with other online platforms, such as Google Ads, it is a handy tool to get an overview of your business’s digital analytics.
Google Tag Manager:
Google Tag Manager is a tag management system (TMS) that allows you to quickly and easily update measurement codes and related code fragments collectively known as tags on your website or mobile app. Once the small segment of Tag Manager code has been added to your project, you can safely and easily deploy analytics and measurement tag configurations from a web-based user interface.
When Tag Manager is installed, your website or app will be able to communicate with the Tag Manager servers. You can then use Tag Manager’s web-based user interface to set up tags, establish triggers that cause your tag to fire when certain events occur, and create variables that can be used to simplify and automate your tag configurations.A Tag Manager container can replace all other manually-coded tags on a site or app, including tags from Google Ads, Google Analytics, Floodlight, and 3rd party tags.
Whatagraph Dashboards:
The whatgraph dashboards previews the important metrics related to the website including conversions, events, number of users and performance about ads and campaigns by the website. This dashboard helps in drawing some of the useful insights for the website notifying the strengths,gains and areas of improvement.
Project Deliverables
Main deliverables for the project are:
- Setup the Google Analytics and Google Tag Manager for the website.
- Tracking events on Google Analytics using Tags created in Google Tag Manager.
- Monthly Reporting of Analytics for businesses on Whatagraph dashboards or via presentations.
- LinkedIn and Facebook Pixel setup and validation for the website.
- Setup Goal Conversions for the website to track the important and valuable metrics from the website.
Tools used
- Google Analytics: To track events, goal conversions and analyse the traffic sources/medium, the top viewed pages and the top cities and countries.
- Google Tag Manager: To set up the tags and triggers of button clicks, page visits as events in Google Analytics.
- Whatagraph: To visually represent important metrics like impressions, clicks, goal completions and many more related to Ads management and Google Analytics.
- Clickup: This tool is used to manage tasks given.
Skills used
- Digital Analysis
- Data Analysis
- Digital Marketing
- Google Analytics
What are the technical Challenges Faced during Project Execution
The main technical challenge faced was that any changes in Google Analytics are operational after 24 hrs. Thus, we can’t judge if the setup works as per required.
How the Technical Challenges were Solved
We had to wait for 24 hours to check the setup. We could use real-time report as well to check the setup on-the spot.
Business Impact
This analysis helps to improve website performance, understanding user behavior, understanding the impact of business campaigns and improvising the UI/UX to increase their potential users.
Having insight into your clients’ behaviour and demographics can help you make decisions about serving them the right products at the right time for maximum chances of a sale. Such data could include a client’s persona, such as their age, location, and areas of interest.
Some of the common metrics that are important in digital analytics include:
Dashboard metrics:
Some examples are pages per visit, bounce rate, and average duration of each visit.
Most exited pages:
Pages with an exit rate of 75–100% show that you need to examine the problem with the content and improve upon it.
Most visited pages:
These pages will make the customers either exit or explore the website further.
Referring websites:
These are other websites that link to your website.
Conversion rate:
This indicates whether the goal of your website was achieved, be it a sale of a product, a free giveaway, or a subscription to a newsletter.
Frequency of visitors:
This tells you about the loyalty of the customers.
Days to the last transaction:
This refers to the time lapse between the first visit and the sale. The shorter the time taken, the better it is for your business.
Project Snapshots

Figure 1: Google Tag Manager Domains

Figure 2: Google Tags

Figure 3: Google Analytics

Figure 4: Google Analytics
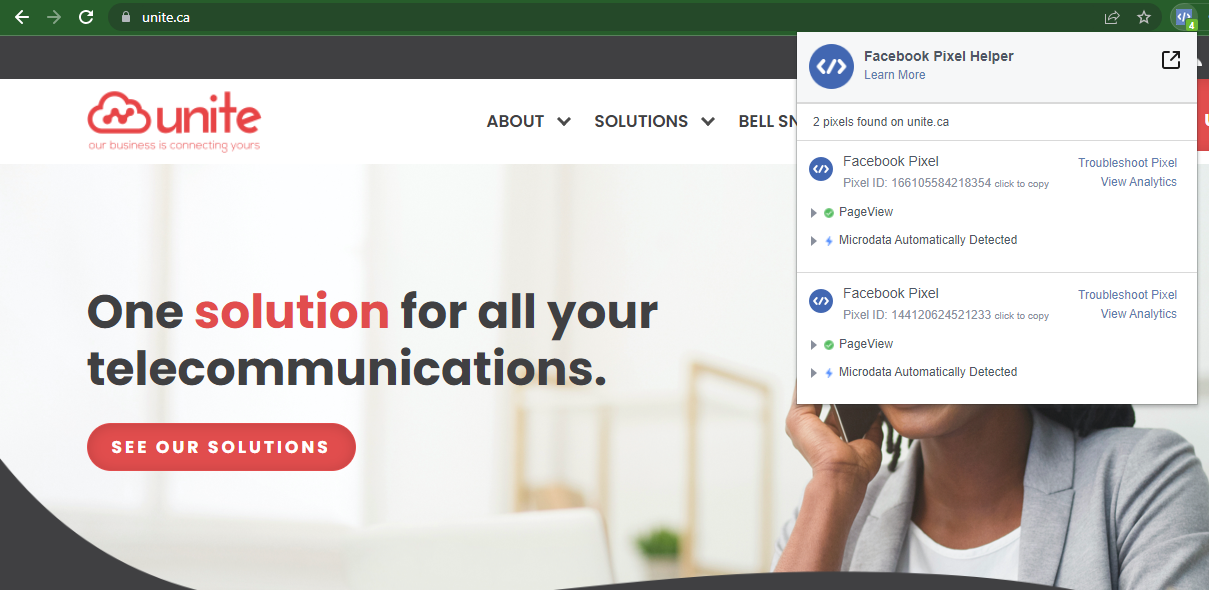
Figure 5: Tracking Facebook Pixels for a website

Figure 6: Whatagraph dashboard

Figure 7: Whatagraph Dashboard(Conversions)


