


Client Background
Client: A leading climate tech firm in the USA
Industry Type: Climate
Products & Services: Product Development
Organization Size: 100+
About the Client:
The client is an organization focused on climate intelligence and environmental risk assessment, supporting planners, policymakers, and infrastructure stakeholders in making data-driven decisions. They required a modern, interactive platform to translate complex climate projections into clear, location-specific insights. Their objective was to move beyond static reports by leveraging geospatial visualization and real-time climate data to improve risk awareness, strategic planning, and long-term resilience against changing weather patterns.
Climate Risk Cube Web App
Climate Risk is a platform that helps people understand how climate change will reshape the world around them. It provides interactive maps, stories, and data tools to visualize the impacts of different warming scenarios. The site translates complex climate science into accessible insights for individuals, businesses, and governments. Its goal is to turn awareness into action through better understanding.
The Problem
Understanding and visualizing climate risks—especially in terms of future precipitation and weather patterns—can be complex for decision-makers. Traditional methods of reporting are slow, non-interactive, and often disconnected from geospatial context.
Our Solution
We developed an interactive web application that allows users to:
- Log in securely.
- Select and confirm specific geographic locations.
- Choose a climate scenario and view projections (e.g., precipitation and weather) for those areas.
- See a visual report preview overlaid on a Mapbox-powered map, contextualized by the chosen data and locations.
- This application integrates real-time climate data and presents it in a clear, map-based interface for faster, smarter decision-making.
Solution Architecture
Frontend (React.js + Mapbox)
- Dynamic UI for login, map interaction, and scenario configuration
- Map-based location selection
- Modular component design for scalability
Backend (FastAPI)
- RESTful API design for handling data and business logic
- Integrates with Probable Futures API to pull climate scenario datasets
- Parses and processes location data to match risk projections
- Handles PDF parsing and full-text search for related documents
Cloud Infrastructure (GCP)
- Google Cloud Compute Engine hosts the FastAPI backend
- Firebase Hosting serves the React frontend
- GCP IAM provides secure, role-based access control
- Firestore and MongoDB used for managing user data and complex geospatial relationships
Tech Stack
- Tools used
- Nextjs
- Fast API
- GCP(Google Cloud Platform)
- Language/techniques used
- Python (Fast APi)
- JavaScript (React)
- Skills used
- Full-stack development
- Cloud deployment (GCP)
- Data structure and algorithm optimization
- Databases used
- MongoDb(for relationships and embeddings)
- Web Cloud Servers used
- Google Cloud Compute Engine
- MONGODB IN GCP
What are the technical Challenges Faced during Project Execution
- Efficient Management of Complex UI State
Handling dynamic tables with custom questions and policy uploads, while keeping performance smooth and UI consistent. - Lag in Map Rendering
Displaying large tilesets or multiple layers on Mapbox led to performance issues, especially on lower-end devices or unstable connections. - Tileset Efficiency
Loading climate scenario data and visual layers dynamically without blocking the main thread or causing frame drops. - API Data Load Times
Probable Future API returns large datasets; initial loads slowed the UI and impacted the user experience.
How the Technical Challenges were Solved
- Tileset Optimization:
We used Mapbox vector tiles and limited zoom levels where appropriate. Tilesets were pre-processed and simplified to reduce size while preserving key data. - On-Demand Loading:
Climate data is fetched lazily—only for selected locations and scenarios. Debounced API calls and conditional rendering reduced unnecessary re-renders. - Caching & Memoization:
Applied browser-side caching and memoization for climate data and map layers. Reused tiles and minimized API re-calls unless input changed. - Performance Profiling:
Used browser dev tools and React Profiler to find bottlenecks and restructure components for better rendering performance.
Business Impact
- Faster Decision Making:
Users can quickly assess risk scenarios and visualize future climate impacts without needing technical GIS tools. - Improved User Experience:
Reduced load times and smoother map interactions make the tool accessible to a broader range of users. - Scalable Infrastructure:
Built to handle expansion—new data sources, user roles, and additional map layers can be added without re-architecting.
Credibility Through Data Integrity
Leveraging Probable Futures ensures the platform is backed by trusted, scientifically validated climate data.
Project Snapshots
1.Login Page
2.Show Locations
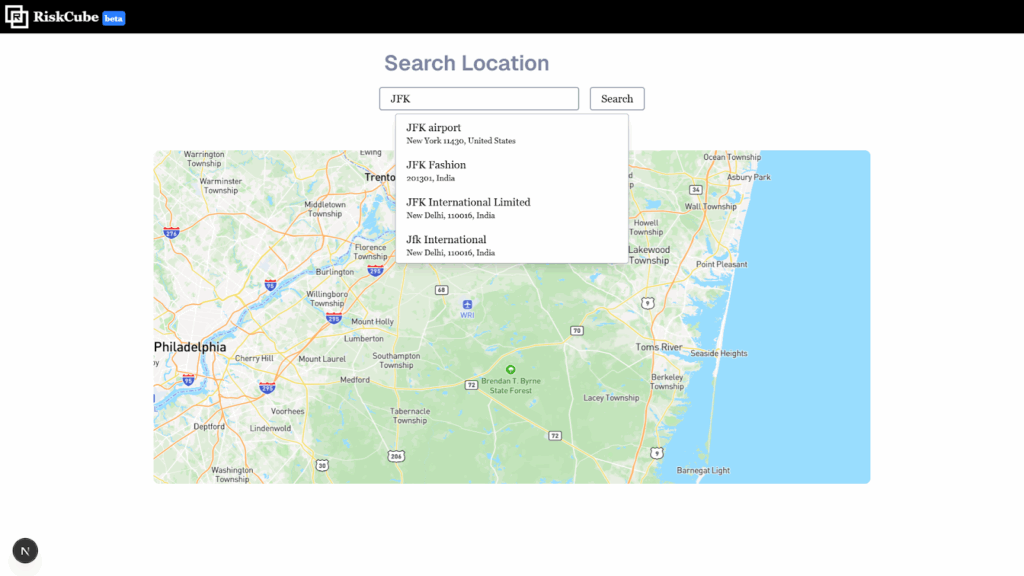
3.Show searched Locations
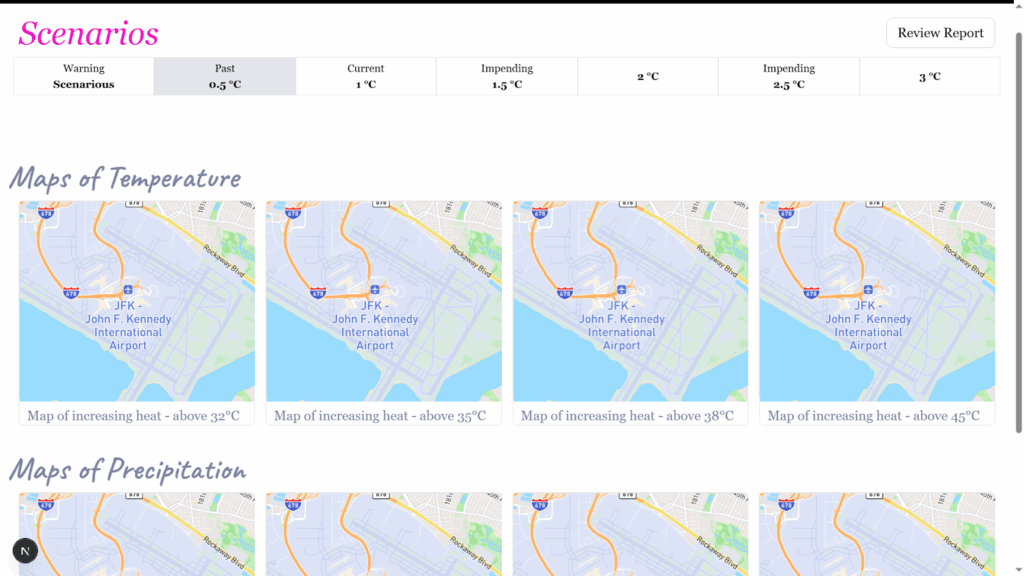
4.Select Report Scenarios
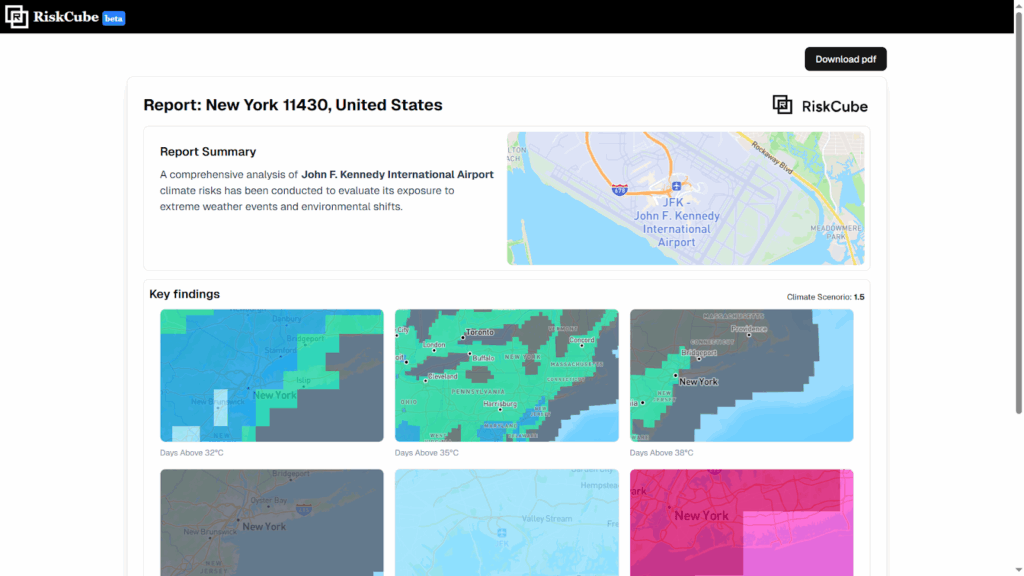
5.Report
Project website url
Project Video
Contact Details
This solution was designed and developed by Blackcoffer Team
Here are my contact details:
Firm Name: Blackcoffer Pvt. Ltd.
Firm Website: www.blackcoffer.com
Firm Address: 4/2, E-Extension, Shaym Vihar Phase 1, New Delhi 110043
Email: ajay@blackcoffer.com
WhatsApp: +91 9717367468
Telegram: @asbidyarthy


 Tool using BERT")


 Dashboard")
