


Client Background
- Client: A leading IT & Tech firm in United States
- Industry Type: IT & Services
- Products & Services: Data Analysis & Monitoring System
- Organization Size: 100+
The Problem
Looking for a Grafana expert to set up uptime and performance monitoring for ~20 SaaS services (Shopify, NetSuite, AWS, Zoom, etc.) using Grafana Cloud. Which include dashboard setup, alerting (Slack/email), and documentation.
Our Solution
To address the requirement, we build a comprehensive monitoring dashboard setup in Grafana Cloud, creating detailed uptime and performance dashboards for each individual SaaS service, along with a unified, consolidated dashboard for overall visibility. We also configured automated alerting via Slack channel, and documented each detail
Deliverables
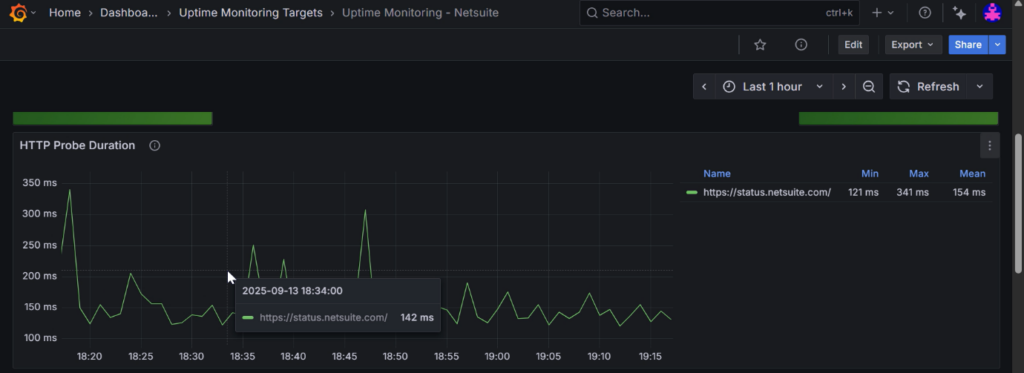
Uptime monitoring Grafana Dashboard
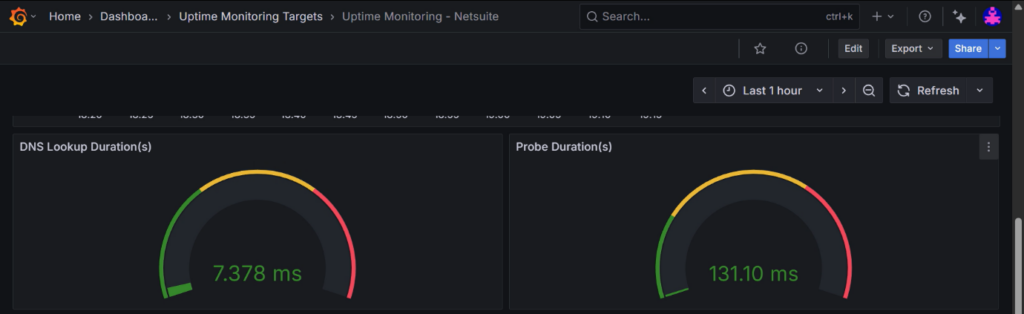
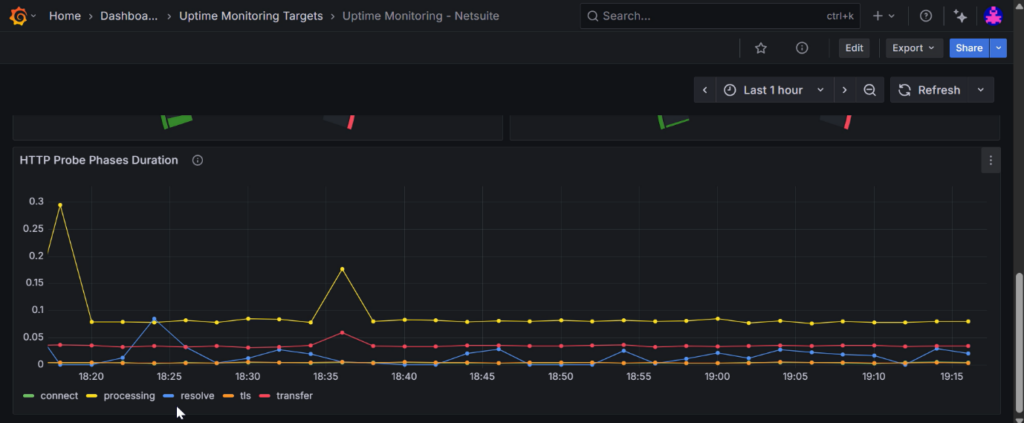
Performance Dashboard
Consolidated Dashboard
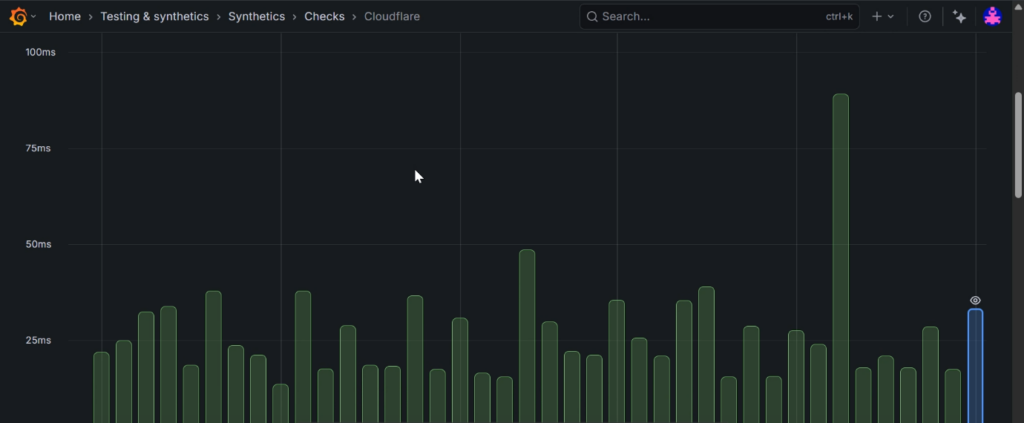
Alerts and probes checks
Documentation
Tech Stack
- Tools used
- Grafana
- Language/techniques used
- LogQL, Visualization, Data Analytics
- Models used
- No Models Used
- Skills used
- LogQL, Data analysis
- Databases used
- No Databases used
- Web Cloud Servers used
- No Web Cloud Servers used
What are the technical Challenges Faced during Project Execution
One of the primary technical challenges involved handling logs and data generated by various data sources. Each data source contained multiple jobs and instance classes, all producing data in different formats.
How the Technical Challenges were Solved
We solved the technical challenge by using LogQL with regex to filter and extract useful information from the data. This allowed us to apply conditions and thresholds, making it possible to assign values correctly and use color-coding in the dashboard.
Business Impact
These monitoring dashboard setup gives the team real-time visibility into the uptime and performance of all SaaS services, helping them quickly detect and respond to issues. This reduces downtime, improves service reliability, and the consolidated dashboard gives clear observability of each action. It also ensures faster decision-making and smoother operations across the organization.
Project Snapshots
Project Video
https://www.loom.com/share/2186628d47be40ab84911649518aeb10?sid=09a68631-639a-4984-a79d-53945bf823e9
https://www.loom.com/share/c73bbee09e964feba25fe8df70f23fc6


