


Client Background
Client: A Leading Tech Firm in the USA
Industry Type: IT & Consulting
Services: Software, Business Solutions, Consulting
Organization Size: 200+
Project Objective
Get statistics such as uptime, availability, cpu throughput etc. from Auvik and Connectwise and make a dashboard from it in Grafana.
Project Description
Unlike many technologies for which plugins are readily available in Grafana, there are none for auvik and Connectwise. So our task was to device a solution through which all the data from Auvik and Connectwise can be fed to Grafana. This data then would be used to plot graphs in Grafana.
Our Solution
- Setup Postgres on linux
- Create appropriate databases, tables and users in it.
- Use python to get data from Auvik and Connectwise and perform necessary preprocesing.
- In the same python file, Connect to our postgres database.
- Ingest this data into postgres database.
- Setup Grafana.
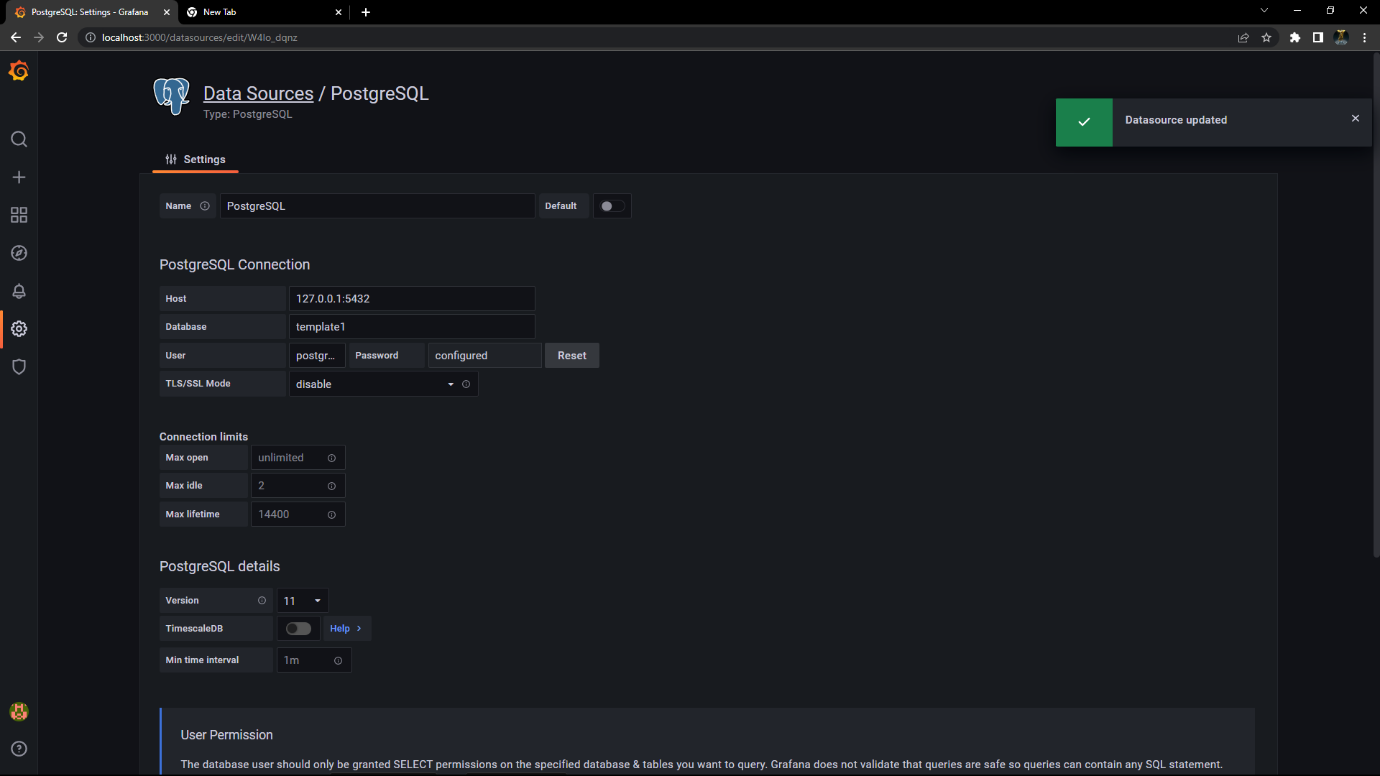
- Connect Grafana to postgres using the postgres plugin.
- Query our postgres database in Grafana to get desired results.
- Plot multiple graphs according to client’s requirement and make a dashboard from it
Project Deliverables
- Setup Postgres
- Setup Postrges in Grafana
- Write Python code to get data from Auvik and Connectwise into Postrges
- Plot graphs into Grafana according to client’s requirement
- Make dashboards for all the graphs
Tools used
Grafana
Postgres
Vs Code
AWS
Postman
Language/techniques used
Python
bash
Skills used
Python
networking
Data visualisation
Databases used
Postgres
Web Cloud Servers used
Amazon Web Services (AWS)
What are the technical Challenges Faced during Project Execution
Since, the data received from Auvik was in Json fromat, our first approach was to use Grafana’s built-in Json plugin. But this wasn’t working since, the data received from Auvik was multi-dimensional when the Json plugin required One dimensional data.
How the Technical Challenges were Solved
The above challenge was addressed by transforming the multi- dimensional data into one dimensional when it was store in a python variable. This transformed data was then inserted into Postgres.
Project Snapshots


Project website url
https://github.com/AjayBidyarthy/Henry-Pardo


")


