


Client Background
- Client: A leading retail firm in Australia
- Industry Type: Retail
- Products & Services: Retail Business
- Organization Size: 2000+
The Problem
The client required a dynamic dashboard system to track and visualize KPIs for multiple stakeholders using data from Monday.com. The challenges included real-time data syncing, dashboard customization per client, and automating the workflow between different tools like Make.com, Google Sheets, and Klipfolio.
Our Solution
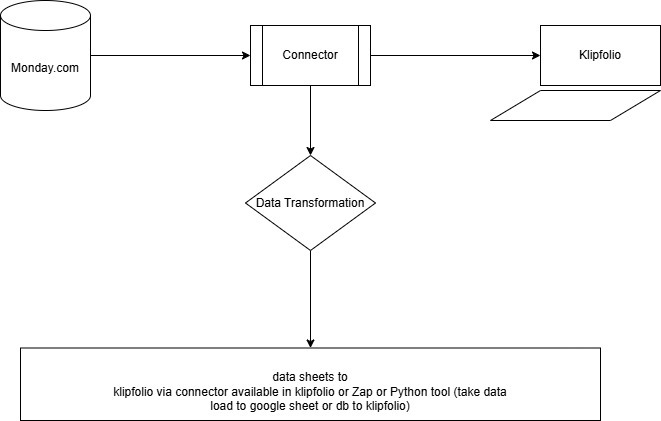
We designed and deployed an integrated ETL pipeline that extracts data from Monday.com, transforms it using Make.com, and loads it into Google Sheets. Klipfolio then reads from Google Sheets to generate real-time KPI dashboards. This approach allowed for custom dashboards for different clients (TLF, REF, etc.) with automated updates when Monday.com data changes.
Solution Architecture
Deliverables
- Access and integration setup for Monday.com, Make.com, and Klipfolio.
- Fully functional dashboards for clients including TLF and REF.
- ETL flow for syncing Monday.com to Klipfolio via Google Sheets.
- KPI identification and visualization tailored per client.
- Iterative revisions based on client feedback.
- Finalized, error-free dashboards with week-in-review insights.
Tech Stack
Tools Used
- Monday.com
- Make.com
- Klipfolio
- Google Sheets
Languages/Techniques
- Data Transformation (via Make.com scenarios)
- KPI Design & Visualization
- Automation & Scheduling
Skills Applied
- ETL Design
- API Integration
- Dashboarding
- Client Requirement Gathering
Technical Challenges Faced
- Multiple tool integrations (Monday.com, Make.com, Klipfolio, Google Sheets).
- Real-time syncing between dynamic boards and dashboards.
- Client-specific customizations and revisions.
- KPI logic building across various business functions.
How We Solved Them
- Used Make.com to build scalable automation flows.
- Enabled data pull into Google Sheets with real-time triggers.
- Created multiple versions of dashboards for iterative feedback.
- Applied error-checking mechanisms and data consistency validations.
Business Impact
- Enabled fully automated reporting for HR and business KPIs.
- Reduced manual effort in dashboard creation and updates.
- Enhanced client decision-making with real-time metrics.
- Supported multiple client teams (TLF, REF, etc.) with tailored dashboards.


 Tool using BERT")


