Client Background
Client: A leading marketing firm in the USA
Industry Type: Market Research
Services: Marketing, Consultancy
Organization Size: 100+
Project Description
Phase – 1: In this project first of all we have made heatmap between two columns named Author and Data Source. Then after two combining two tables named NY_data and nodeid_views made the report of all of the data.
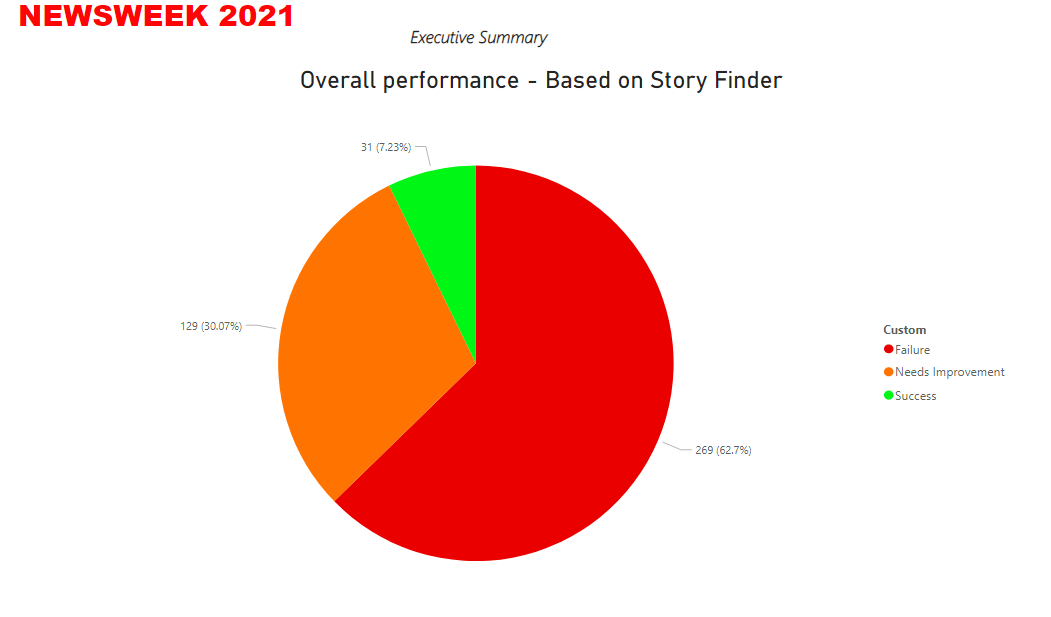
Phase – 2: Success of story was given by if pageviews is more than 35000, if pageviews lies between 3500-35000 the story was labelled as needs improvement and if it was below 3500 the story was labelled as failure.
Phase – 3: The powerbi report was made to find different insights in the data like different tables were drawn between different attributes of data like pie chart, time series chart, comparison charts. The data is updated every week and the report is generated automatically.
Our Solution
We provided them Phase 1 in the powerbi sql editor by combining two tables using sql queries. For phase 2 we just used the power bi program tool and written a script in Python to calculate the success of story. For Phase 3 we used the internal features of Power BI to find insights of the data.
Project Deliverables
We have provided a PowerBI report file as deliverable for the project.
Tools used
Python, PowerBI, Google Chrome
Language/techniques used
Python Programming and SQL queries editor.
Models used
Waterfall model used in this project.
Skills used
Data cleaning, Data Pre-processing, Data Visualisation are used in this project.
Databases used
We have used the traditional file systems as database storage.
What are the technical Challenges Faced during Project Execution
- Drawing heatmap in the PowerBI.
- Combining two tables on the basis of the pageviews.
- Converting the time series to data to 5 minute format.
How the Technical Challenges were Solved
We installed a new add on in the PowerBI to draw heatmap for the project and used the SQL editor to combine the tables on the basis of page views. We used python programming to convert the time series data to 5 minute time gap format.
Project Snapshots