


Client Background
Client: A leading retail firm in Australia
Industry Type: Retail
Services: e-commerce, retail business, marketing
Organization Size: 100+
Project Objective
Bringing in data from many sources(Google Analytics , ServiceM8 and Xero etc.) and making Business Dashboard KPIs in Wink Report.
Project Description
For building Business Dashboards in Wink Report , collect data from the following sources –
- ServiceM8
- Xero
- Google Ads
- Communiqa
Explore/analyze the underlying data tables from each Data Source. Make useful reports using different tables from different data sources based on client’s requirement. Set up formulas in each report to calculate desired fields. Add a custom visualization to each report for making dashlets. Add dashlets to newly created dashboards.
Our Solution
For collecting the data from the sources (ServiceM8 , Xero , Facebook , Google Ad) native connectors have been used , available in the Wink Report. It fetches the following data/tables from around the given data sources –
- ServiceM8 Connector –
- Assets
- Client
- Invoices
- Job Allocations
- Jobs
- Materials
- Payments
- Xero Connector –
- Bank Transaction Items
- Budget Vs Actual
- Employees
- Payments
- Payslip
- Products
- Purchase Orders
- Purchase Invoices
- Sales Invoices
- Transaction
- Facebook Connector –
- Facebook Ad Insights
- Google Ads Connector –
- Ad Insights
- Google Analytics Connector –
- eCommerce Campaign
- Totals
Data Pipeline : For collecting data from Communiqa website (https://www.communiqa.com.au/) , web scraping has been used as there is no connector available for Communiqa to Wink Report. By scraping Communiqa , we get the following data –
- Account , Date , Total calls , Total unanswered calls , Total engaged calls , Total answered calls , Total minutes etc.
Then , we have merged different tables from different sources to get desired reports. Store all reports belonging to the same dashboard in a separate folder. Do this for all the dashboard , then setup formula for calculating desired fields. Add appropriate visualization to each report for each folder. Then , finally add all dashlets belonging to the same folder to a newly created dashboard.
Project Deliverables
Below are the services that we provided to client after completion of this project –
- Data Pipeline(Communiqa to Wink Report) : A Data Pipeline connecting Communiqa to Wink Report to sync in the following data tables –
- CSR calls [Account , Date , Total calls , Total unanswered calls , Total engaged calls , Total answered calls , Total minutes etc]
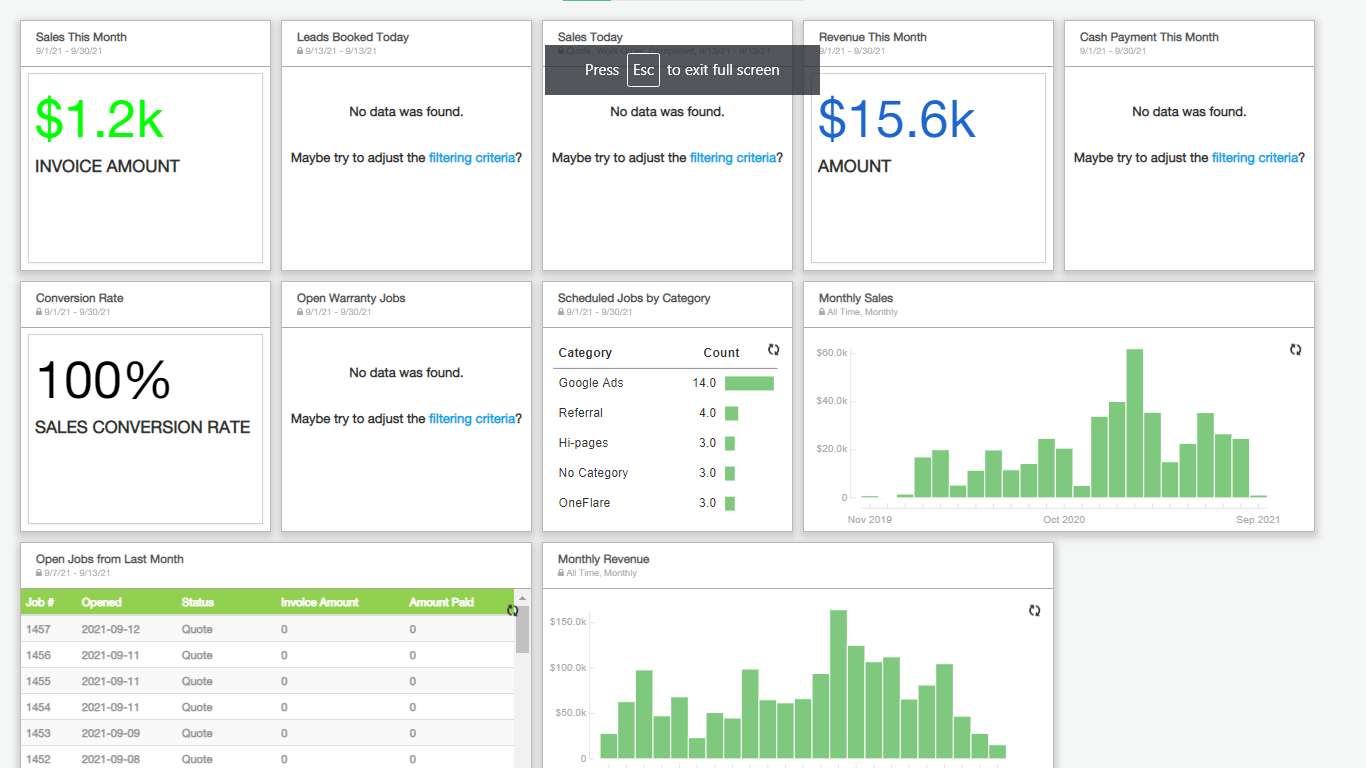
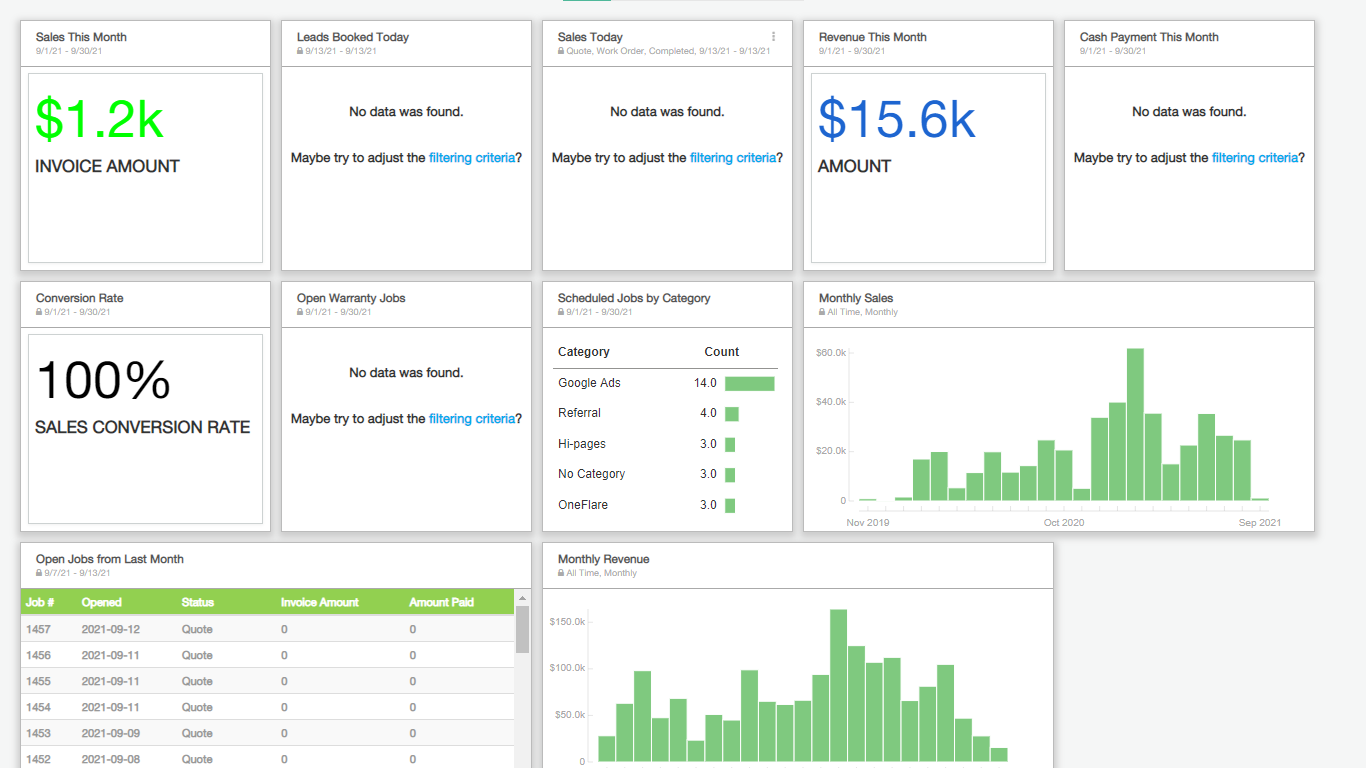
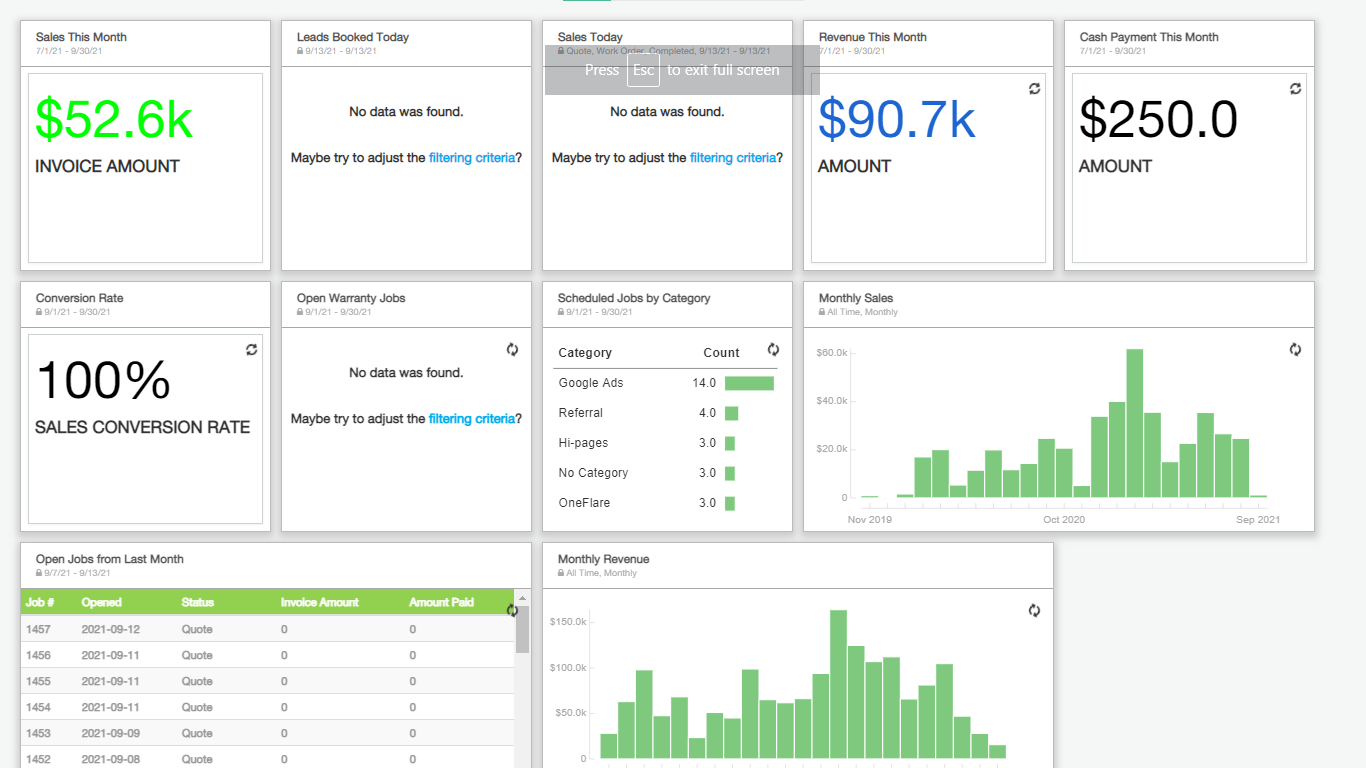
- Company Performance Dashboard : It contains following visualizations –
- KPIs –
- Sales This Month
- Leads Booked Today
- Sales Today
- Revenue This Month
- Cash Payment This Month
- Conversion Rate
- Open Warranty Jobs
- Bar Charts –
- Scheduled Jobs by Category
- Sales by Month
- Revenue by Month
- Tables –
- Open Jobs from Last month[Job Id , Opened Date , Status, Invoice Amount, Amount Paid]
- Filters/Slicer –
- Date Range
- Job Status
- Date Grouping(Daily/Monthly/Yearly)
- Lead Generation Dashboard –
- KPIs –
- Total Website Traffic this month
- Average Daily Website Traffic this month
- No. of Conversion this month
- Total Marketing Investment this month
- Marketing Budget Tracking
- Cost per Acquisition
- Line Charts –
- Link Clicks and conversion by month
- Total marketing spend by month
- Bar Chart –
- Lead Generation Count by Source
- Pie Chart –
- Lead Generation Source by Invoice Amount
- Filters/Slicer –
- Date Range
- Job Status
- Lead Conversion Dashboard –
- KPIs –
- All Employees monthly Sales Target
- All Employees monthly Conversion Rate
- Filters/Slicer –
- Date Range
- Job Status
- Company Leads/Target Dashboard –
- KPIs –
- Total Hi-pages Lead today
- Total Hi-pages Lead this month
- Total OneFlare Lead today
- Total OneFlare Lead this month
- Total Google Ads Lead today
- Total Google Ads Lead this month
- Total Facebook Ads Lead today
- Total Facebook Ads Lead this month
- Company Daily Sales Target
- Company Monthly Sales Target
- Filters/Slicer –
- Date Range
- Job Status
Tools used
Wink Report
Language/techniques used
- Python
- Web Scraping
Skills used
- Data Analytics
- Data Visualization
- Programming in Python
- Data Structure & Algorithm
- Web Scraping
- File Handling
What are the technical Challenges Faced during Project Execution
- Merging reports from different data sources : Faced the issue of making the cross report from different data sources.
- Take live parameter input daily in Dashboards from User : Taking live user parameter input daily to feed in Wink report Dashboard. So that dashboard KPIs can change accordingly.
How the Technical Challenges were Solved
- Merging reports from different data sources : Resolved this issue by using merge report configuration. Using this we were able to join tables from different data sources like – Left join , Right join , Union etc.
- Take live parameter input daily in Dashboards from User : To resolve this issue , we added a custom field in reports with input tag. Users can enter their parameter in this custom field and all dashlets in the dashboard would update automatically.
Project Snapshots


 Dashboard")


