

Client Background
- Client: A leading IT & Tech firm in Europe
- Industry Type: IT & Services
- Products & Services: Data Analysis & Monitoring System
- Organization Size: 200+
The Problem
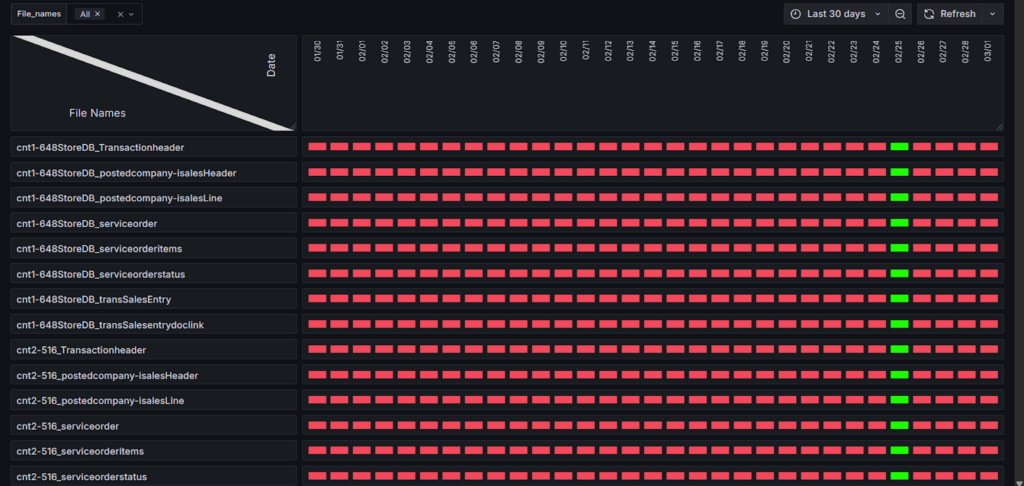
We need a Grafana expert to create a dashboard that monitors application health and process execution using Loki logs in a Kubernetes cluster. The dashboard should track whether 32 specific events occurred each day, displaying days as rows (in YYYY-MM-DD format) and events as columns, with green/red indicators showing success or failure.
Our Solution
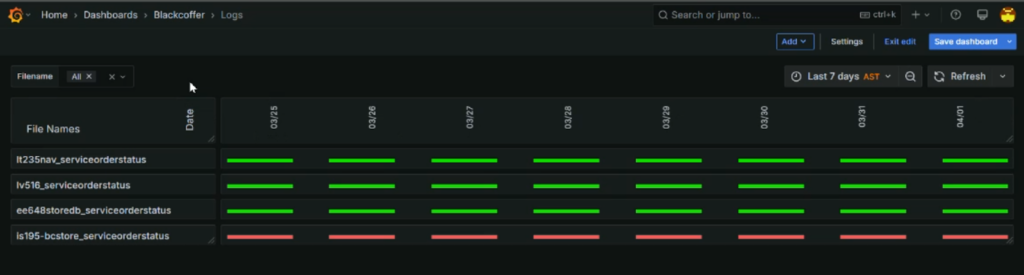
To address the requirement, we built a Grafana dashboard using Loki logs where the layout was modified by switching the date values from rows into columns and the event or file names from columns into rows. This transformation allowed us to create a clear matrix view where each cell represents whether a specific event (or file) occurred on a given day. The dashboard uses color-coded indicators—green if the event is present on that day and red if it’s missing—making it easy to visually monitor daily event execution and quickly identify any issues.
Deliverables
Grafana Dashboard
Documentation
Tech Stack
- Tools used
- Grafana
- Language/techniques used
- LogQL, Visualization, Data Analytics
- Models used
- No Models Used
- Skills used
- LogQL, Data analysis
- Databases used
- No Databases used
- Web Cloud Servers used
- No Web Cloud Servers used
What are the technical Challenges Faced during Project Execution
One of the main technical challenges we faced during the project was working with logs generated by Loki from the Kubernetes cluster. These log entries are usually in plain string format, which makes it difficult to extract and process specific information needed for the dashboard.
How the Technical Challenges were Solved
We solved the technical challenge by using LogQL with advanced regex to filter and extract useful information from the log entries. This allowed us to apply conditions and thresholds, making it possible to assign values correctly and use color-coding in the dashboard.
Business Impact
The dashboard provides a clear daily view of whether all 32 key events have occurred, using simple green/red indicators. This reduces the need for manual log checks, helps the team quickly detect and respond to missing or failed events, and improves overall monitoring efficiency. As a result, it enhances system reliability, minimizes downtime, and saves valuable time for the operations team.
Project Snapshots


 using Ant Colony System")


