


Objective:
- Create a BI tool for real-time sentiment analysis of consumer.
- The tool will help with the decision-making process.
Scope for Real-Time sentiment analysis tool:
- The project was made for one of the biggest chain restaurants in Hawaii and California, USA.
- The project motive was to create a decision making and BI tool that can perform real-time sentimental analysis of consumers.
- The tool is helping the owner and stakeholders of Restaurants in Taking the decision to improve upon negative responses.
Methodology of Real-Time sentiment analysis tool:
- The data for analysis is taken from tweets on Twitter, Facebook posts, and reviews, Yelp reviews, YouTube videos, and comments.
- hashtags were also taken into analysis that was related to that particular restaurant.
- Reviews and comments are sorted on the basis of positive, neutral and negative response.
- Weightage to response was given to create a visualizations report. Graph, time series, scatter plot was made of all responses.
- Insights and suggestions were given to the owner on How they can improve their product and services on the basis of reviews and market practices.
- An API Is made along with the tool so that the owner of the Restaurants can perform analysis in real-time.
Data Interpretation and Visualization:
Following are the visualization of how the dashboard will look and data analytics is done.
1. Graph of daily website activity

2. Social media activity data

3. Both Analytics combined data

4. Social analytics visualization

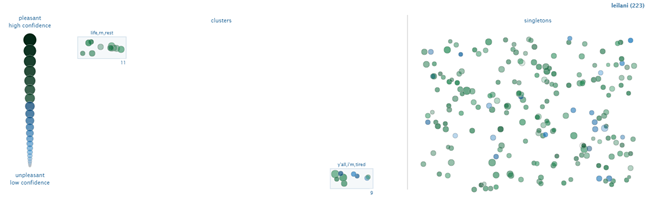
5. Scatter plot according to consumer’s posts

6. Cluster plot for collective visualization
7. Heat map of posts frequency

8. Diagram of cluster tree showing how consumer posts are related

9. Consumer behaviour pattern from post frequency related to time

10. Words cluster, chosen for rating customer behaviour

Result:
- Suggestion to retails were: change price, better your parking system, introduce various events to differentiate from customers, musician, improve taste according to American preferences, provide additional sugar sachets according to sweetness acceptance.
- Retailers have changed and modified their dishes in order to please their customers, and prices are changed according to feedback analysis.
Sentiment-Analysis-for-retailDownload
