Client Background
Client: A leading healthcare provider firm in the USA
Industry Type: Healthcare, Medical Devices, Pharma
Services: Healthcare Analytics, Healthcare services, Medical Devices, Health fitness devices, Healthcare solutions, and services.
Organization Size: 50+
Customers: B2C
Challenges for AI Dashboard of Health Fitness
- Create a cloud dashboard for the collection of user data for analytics and recommendation report.
- The dashboard should be data-driven, real-time and made for healthcare and medical purpose to use IoT and fitness devices to collect data.
- AI-based auto-recommendation, to achieve fitness target, visualize daily progress, %age completion and motivation to meet the goals.
- Driving forces, know who and why.
- Make it real-time, extracts data from the smart device, visualize it, and compare it with other groups, people, and most importantly with the other worlds.
Project Design for AI Dashboard of Health Fitness
- The Dashboard is being made to collect user activity data from their fitness product/Devices to the cloud.
- The data-driven dashboard will generate a weekly and monthly report regarding user activity.
- The report will contain detailed information related to the stated parameters.
- The Dashboard will help in pushing a notification to the user suggesting what can be done to improve their health report.
- The App will also help the user in knowing the irregular pattern in health to avoid alarming situations.
- The data is collected on the cloud and a personalized report is generated with trained ML and AI.
Data Parameters
- Height / Weight ratio (BMI)
- Blood pressure
- Glucose
- Pulse, Normal and resting heart rate
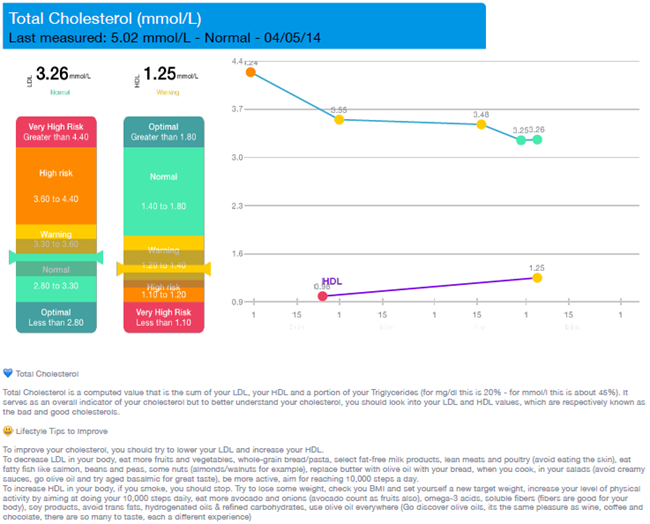
- Cholesterol
- Body Temperature
- Physical Activities: running, walking, climbing, swimming, resting, exercising
- Sleep Pattern
Methodology
- The Dashboard was made using many software tools like Javascript, D3.js, dashboard development tools, for development, and R/Python were used for analysis, data models, and data pipelines.
- The approach was the simple use of persona/DNA and recommendation.
- In persona, the data was collected by the product in set parameters and was sent to the cloud and saved in a format.
- After the data is saved it was analyzed in data-driven dashboard creating health reports and results.
- And the personalized recommendation was sent to the user along with the report. The recommendation factor was trained using ML and AI, to give a different recommendation on the basis of the result.
Data Visualization and Interpretation
Data is collected from different parameters are visualized according to their category. The dashboard will show user data in the following way. From within the dashboard, the user can generate his/her report.


Future Scope of Project
Current feature of dashboard includes:
- Save the report to a dashboard
- Send report by email
- Update and generate PDF reports
- Automation to send a monthly report
Current capabilities can record data of – Walking steps, Running distance, Calories burned, Types of exercises, Heart rate, Weight management, Sleep pattern.
In future it is estimated that app will be able to produce reports that are usable to doctors and medical treatment and the following features will be added:
- Visualization of:
- Problems
- Diagnosis
- Medications
- Procedure
- Immunization
- Allergies
- Vitals
- Lab measures and recommendation