


Project Title
Grafana Custom Visualization for Sensor’s Data (on-premis)
Client Background
- Client: A leading IoT & Tech firm in Singapore
- Industry Type: IoT and Data services
- Products & Services: IoT sensor’s data
- Organization Size: 100+
The Problem
We have IoT devices that collect data from sensors. We need a system that can take this sensor data and show it in a visual format on system (on-premise)
Our Solution
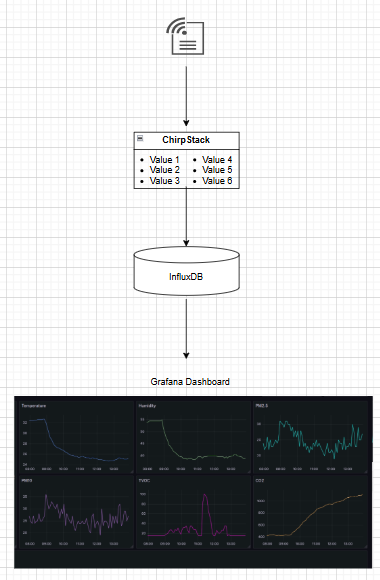
We’ve created a workflow where IoT devices send data using LoRaWAN to ChirpStack. From there, the data is stored in InfluxDB. We then connect InfluxDB to Grafana as a data source. This allows us to visualize the data points on a Grafana dashboard.
Solution Architecture
Deliverables
Grafana Dashboard
InfluxDB setup
Installation and setup Documentation
Tech Stack
- Tools used
- ChirpStack, InfluxDB, Grafana
- Language/techniques used
- Flux SQL , Data Analytics
- Models used
- No Model used
- Skills used
- Data Engineering, Data Analytics
- Databases used
- InfluxDB
- Web Cloud Servers used
- No Web Cloud Servers used
What are the technical Challenges Faced during Project Execution
The main challenge we faced was transferring data into InfluxDB. There were different integration options like using HTTP or MQTT. For HTTP, we had to set up a Flask application. For MQTT, we needed to set up both a publisher and a subscriber. To get the data into an InfluxDB bucket, we also had to configure Telegraf properly.
How the Technical Challenges were Solved
We solved the challenge by using InfluxDB’s direct integration. This allowed us to send data straight to the InfluxDB bucket without needing any middleware, making the process more efficient and easier to manage.
Business Impact
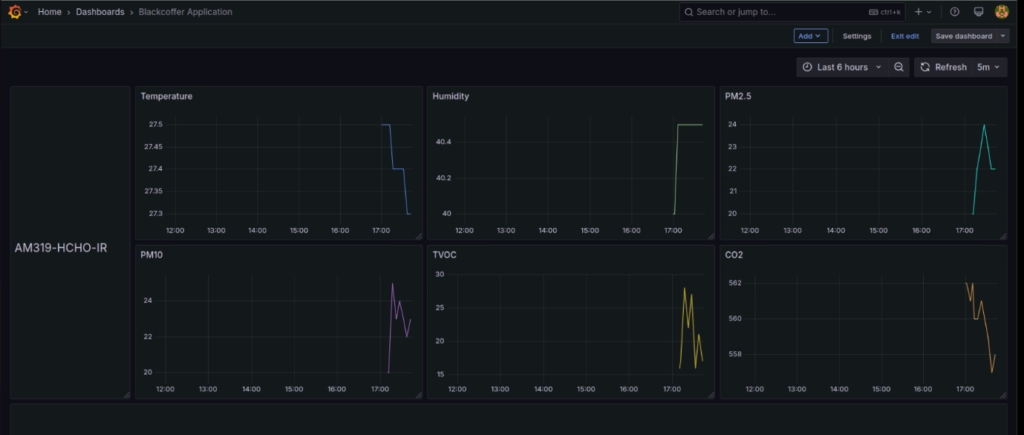
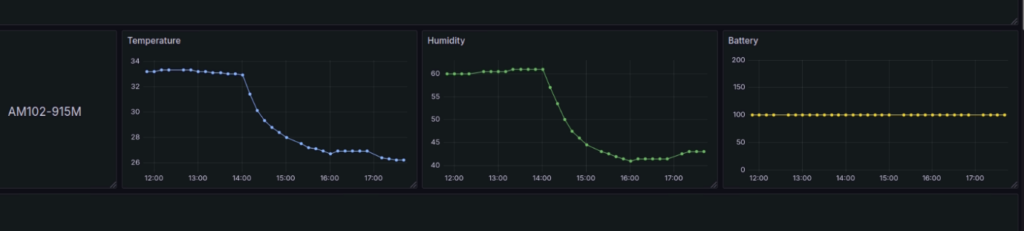
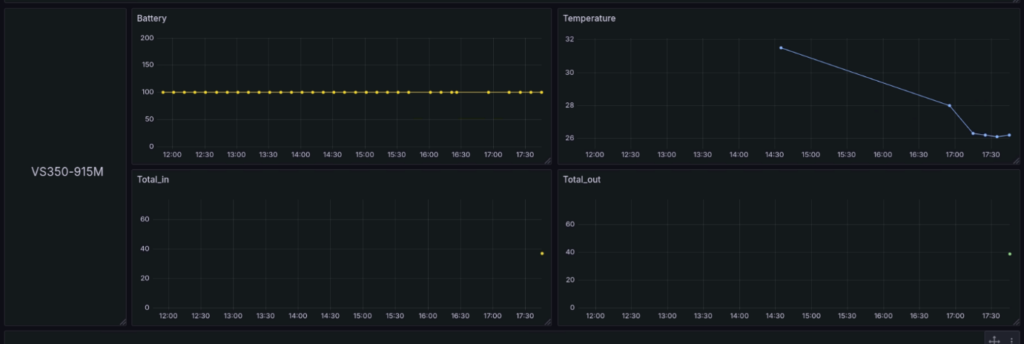
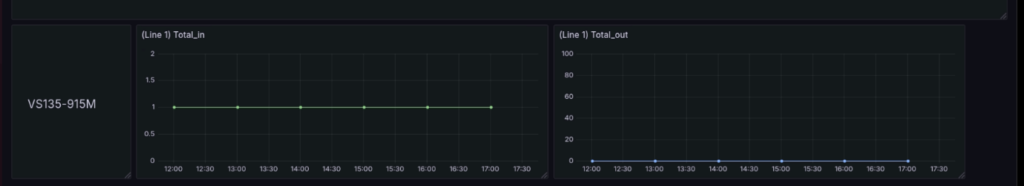
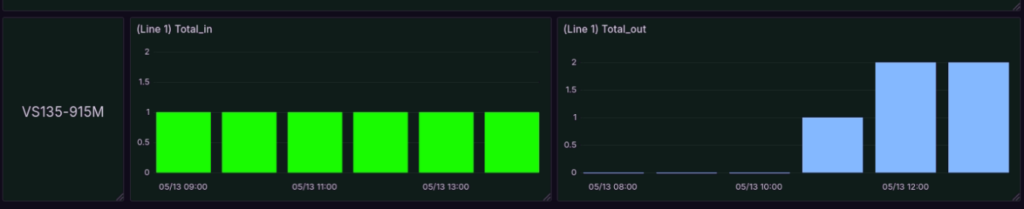
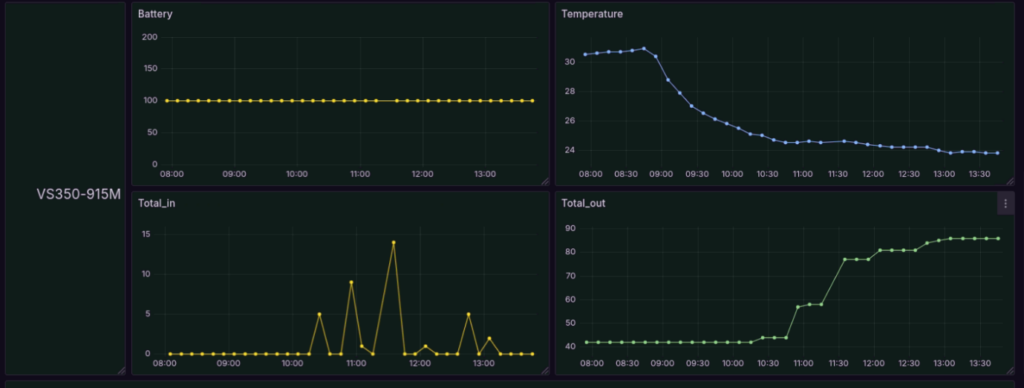
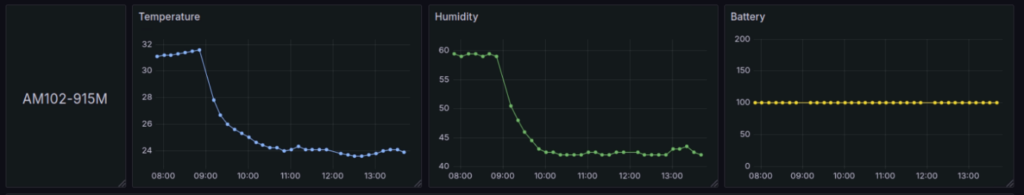
With this setup, sensor data can be easily visualized in Grafana. This makes insights more meaningful and helps track important details like temperature, humidity, and people counting. It provides a clear and detailed view of all the collected data in one place.
Project Snapshots


 Tool using BERT")


 with custom data connectors to manage CRM database")


