


Client Background
- Client: A leading IT & Tech Consulting firm in the middle east
- Industry Type: IT & Data Service
- Products & Services: Data Analysis
- Organization Size: 80+
The Problem
Governments and urban planning bodies often face challenges in efficiently allocating resources and planning for future development due to limited predictive insights into trends in land grant applications and construction services. Existing data on demographic factors such as age, gender, marital status, and service types is underutilized, and there is a lack of robust models to accurately forecast demand.
Without reliable forecasting, decision-makers struggle with:
- Identifying demographic-driven trends in land and construction service applications.
- Planning for fluctuating demand across different service types.
- Addressing gaps in data quality and leveraging scalable analytics infrastructure.
This inefficiency leads to suboptimal resource allocation, delays in urban planning initiatives, and missed opportunities for targeted policy interventions.
The project aims to address these challenges by building a data-driven forecasting framework that integrates advanced modeling techniques, scalable data storage, and interactive visualizations to deliver actionable insights for effective planning and decision-making.
Our Solution
To address the challenges of forecasting land grant applications and construction service demands, we developed a comprehensive data-driven solution combining advanced analytics, forecasting models, and visualization tools. The solution consisted of the following key components:
- Exploratory Data Analysis (EDA):
- Conducted detailed analysis on datasets related to land grants, master constructions, projects, and project villas to identify patterns and trends.
- Extracted insights into demographic factors such as age, gender, and marital status, and their correlation with application trends.
- Forecasting Models:
- Implemented and tested time-series forecasting models (ARIMA and Prophet) to predict future trends in land grant applications and service demands.
- Selected the Prophet model for its superior accuracy, especially with weekly data distribution.
- BigQuery Integration:
- Designed and populated BigQuery tables to store processed data, segmenting trends by demographics, service types, and temporal dimensions (weekly, monthly, yearly).
- Enabled efficient querying and real-time analysis.
- Power BI Dashboards:
- Developed interactive dashboards to visualize past trends and forecasted demand.
- Segmented data by demographics and service types, providing actionable insights for stakeholders.
- Scalable Solution Architecture:
- Built the solution on Google Cloud Platform (GCP) for scalability and seamless integration with analytical tools.
- Centralized data storage and modeling to ensure high performance and accessibility.
This solution empowers governmental and urban planning bodies to make informed decisions, optimize resource allocation, and address future demand for land grants and construction services efficiently.
Solution Architecture
1. Data Collection and Storage
- Datasets: Land Grants, Master Constructions, Projects, and Project Villas.
- Storage:
- Google BigQuery serves as the centralized data repository.
- Tables were designed to capture demographic data, service types, and temporal trends (e.g., weekly, monthly).
2. Data Processing and Analysis
- Preprocessing:
- Data cleaning, handling missing values (e.g., in VILLA_TYPE and VILLA_STYLE), and transforming raw datasets for analysis.
- Exploratory Data Analysis (EDA):
- Insights into trends, correlations, and unique patterns in data.
3. Forecasting Models
- Time-Series Forecasting:
- ARIMA: Tested but discarded due to poor performance (high RMSE).
- Prophet: Selected for its accuracy in weekly, monthly, and yearly forecasts.
- Forecasted Variables:
- Demographic trends (age, gender, marital status).
- Service type demand and distribution.
- Land grant applications and approval counts.
4. Integration and Scalability
- Cloud Infrastructure: Google Cloud Platform (GCP).
- Ensures scalability, high availability, and support for real-time queries.
- BigQuery:
- Designed schema for demographic and service-based forecasts.
- Optimized for large-scale data storage and real-time querying.
5. Visualization and Decision Support
- Power BI Dashboards:
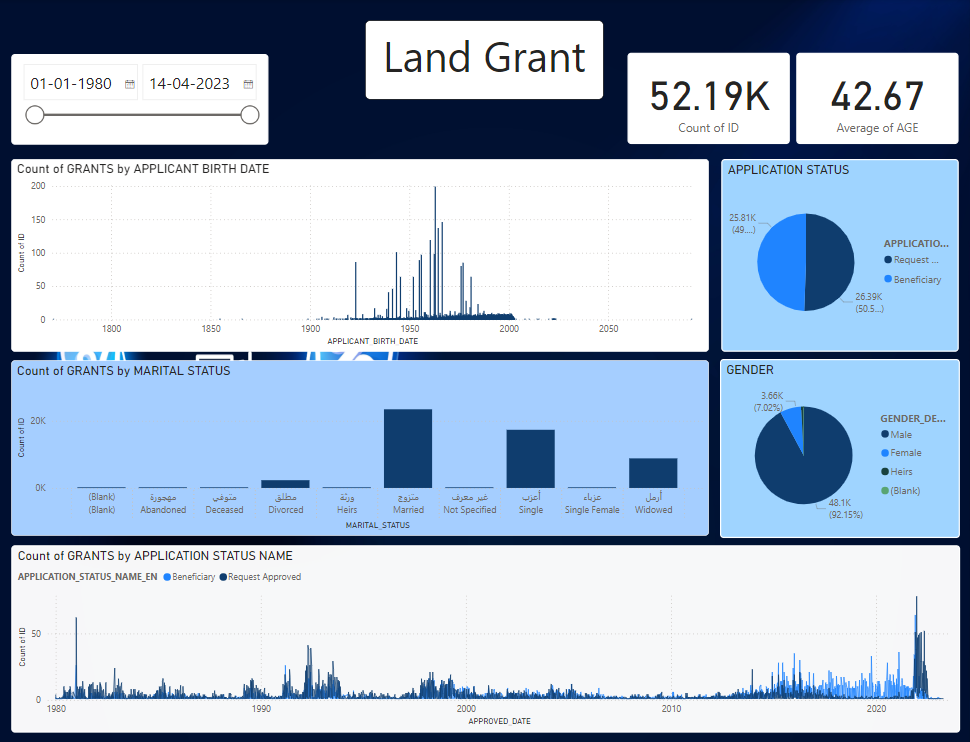
- Page 1: Descriptive analysis of land grant data with demographic insights.
- Page 2: Forecasted trends for land grant applications segmented by age, gender, and marital status.
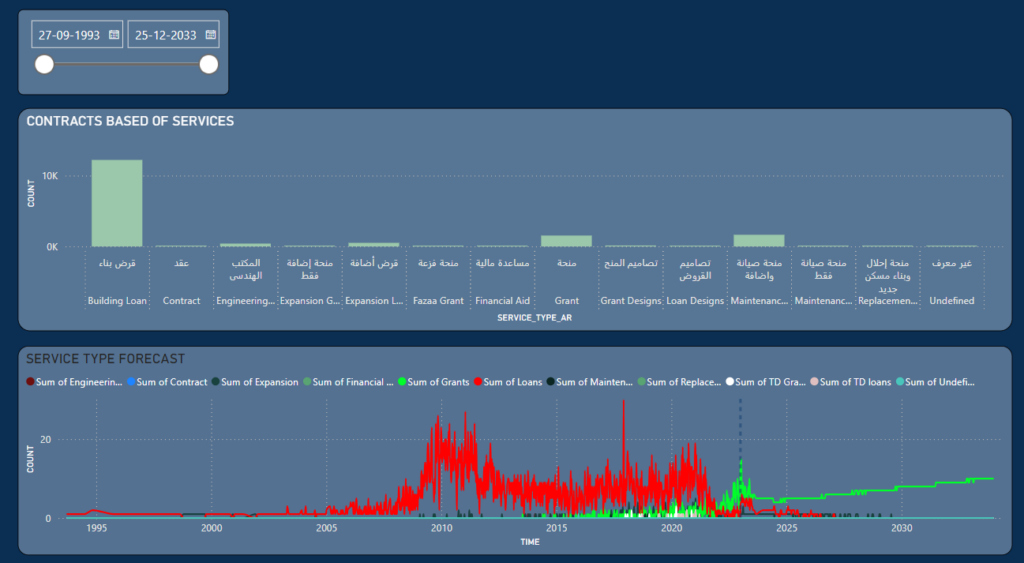
- Page 3: Master construction service analysis and forecasting.
- Visual Outputs:
- Time-series projections.
- Service type breakdowns.
- Demographic trends for targeted analysis.
6. Workflow Summary
- Data Ingestion: Raw data loaded into BigQuery.
- Data Preprocessing: Data cleaned and transformed for analysis.
- Modeling: Forecasting models (Prophet) applied to processed data.
- Storage: Forecast results stored in BigQuery tables.
- Visualization: Power BI dashboards created for stakeholder insights.
Deliverables
1. Forecasting Models
- Prophet-Based Forecasting Framework:
- Developed models to predict land grant applications and master construction service demands.
- Forecasted trends segmented by demographics (age, gender, marital status) and service types.
- Provided granular insights using weekly, monthly, and yearly data resolutions.
2. BigQuery Tables
- Created structured tables to store and analyze data for forecasting and reporting purposes:
- Demographic Forecast Tables: Weekly trends for age, gender, and marital status.
- Service-Based Forecast Tables: Service demand segmented by type and time frequency.
- Land Grant Forecast Tables: Weekly application and approval trends.
- Master Construction Project Tables: Weekly trends for loans, grants, and financial aid.
3. Power BI Dashboards
- Interactive Dashboards:
- Page 1: Descriptive analysis of land grants by demographic and application type.
- Page 2: Forecasted trends in land grant applications segmented by demographic factors.
- Page 3: Descriptive and predictive analyses of master construction data, including loan and service distributions.
- Enabled stakeholders to explore trends and insights interactively for better decision-making.
4. Insights and Recommendations
- EDA Insights: Detailed observations on trends, correlations, and key patterns in the datasets.
- Forecasted Trends: Predictions for land grant applications and service demands, aiding future planning.
- Actionable Recommendations: Policy and resource allocation suggestions based on forecasted data.
5. Scalable Data Infrastructure
- BigQuery Integration: A centralized data repository optimized for scalable analysis.
- Real-Time Analytics: Enabled querying and forecasting on large datasets with high performance.
Tech Stack
- Tools used
- Google Cloud Platform (GCP): For hosting, scalable storage, and real-time analytics through BigQuery.
- Power BI: For building interactive and insightful dashboards for data visualization and decision support.
- BigQuery: For storing large-scale datasets and running efficient SQL queries for analysis and forecasting.
- Python Libraries:
- Pandas and NumPy: For data manipulation and cleaning.
- Matplotlib and Seaborn: For creating static, interactive visualizations during exploratory data analysis.
- Prophet: For time-series forecasting, especially effective in generating accurate predictions with seasonal trends.
- Language/techniques used
- Python: For data processing, model development, and analysis. Used to implement forecasting models, handle large datasets, and perform data manipulation.
- SQL: To query and process data stored in BigQuery, enabling efficient data extraction and analysis.
- Models used
- ARIMA (Autoregressive Integrated Moving Average): Initially tested for time-series forecasting, but discarded due to poor performance and high Root Mean Square Error (RMSE).
- Prophet: Chosen for its high accuracy in time-series forecasting, especially with weekly, monthly, and yearly intervals. It was used to predict trends in land grant applications and service demands based on historical data.
- Skills used
- Data Analysis: Performed detailed exploratory data analysis (EDA) using Python, SQL, and visualization libraries to derive insights from large datasets.
- Statistical Modeling: Applied statistical techniques and time-series forecasting models (ARIMA and Prophet) to generate accurate forecasts.
- Data Engineering: Implemented data cleaning, transformation, and processing pipelines to prepare the datasets for analysis and forecasting.
- Data Visualization: Utilized Power BI for creating interactive and actionable dashboards to present data insights and forecasts to stakeholders.
- Cloud Computing: Used GCP’s BigQuery for scalable storage and querying, ensuring efficient handling of large datasets for real-time analytics.
- Databases used
- BigQuery: A fully-managed data warehouse in Google Cloud, used to store and manage large volumes of data across multiple tables. It enabled fast and scalable querying for both historical analysis and forecasting
- Web Cloud Servers used
- Google Cloud Platform (GCP): Provided the cloud infrastructure for hosting the solution, including storage (BigQuery), data processing, and integrating with external services for forecasting and visualization. GCP ensured scalability and high performance while maintaining data security and reliability.
What are the technical Challenges Faced during Project Execution
Data Quality and Incompleteness
- Missing or incomplete data in key fields, such as VILLA_TYPE and VILLA_STYLE, affected the analysis and required extensive preprocessing.
Model Performance and Accuracy
- The ARIMA model performed poorly with high RMSE, leading to its abandonment, and fine-tuning the Prophet model for optimal performance across different time frequencies (weekly, monthly, yearly) was challenging.
Large-Scale Data Handling
- Managing large datasets (e.g., 50,000+ records) and ensuring that the data processing pipeline was efficient and scalable posed significant challenges, particularly in real-time querying and forecasting.
Integration Across Tools
- Ensuring seamless integration between BigQuery for data storage and Power BI for visualization, while maintaining data consistency and real-time updates, was complex.
Forecasting Accuracy and Variable Selection
- Identifying the most relevant variables for forecasting was difficult, as demographic factors like age, gender, and marital status had moderate correlations with land grant trends but were not strong enough predictors on their own.
How the Technical Challenges were Solved
1. Data Quality and Incompleteness
- Data Cleaning: Missing values in the VILLA_TYPE and VILLA_STYLE fields were handled by imputation or removal based on the context and importance of the fields for analysis.
- Data Preprocessing: Additional steps were taken to identify and correct inconsistencies in the dataset, including standardizing data formats and removing outliers or irrelevant data entries. This ensured that the data used for analysis and modeling was clean and accurate.
2. Model Performance and Accuracy
- Switching from ARIMA to Prophet: The ARIMA model’s poor performance led to the adoption of the Prophet model, which handled seasonal patterns and irregular trends better, delivering more accurate forecasts with lower RMSE.
- Hyperparameter Tuning: To optimize the performance of the Prophet model, various configurations (such as different time frequencies: weekly, monthly, yearly) were tested, and the best settings were selected for forecasting accuracy.
- Multiple Iterations: The model was iteratively refined, adjusting for different seasonalities and holiday effects to improve accuracy and forecast reliability.
3. Large-Scale Data Handling
- BigQuery for Scalability: By using BigQuery, which is designed for handling large datasets, we were able to store and process large volumes of data efficiently without compromising performance.
- Optimizing Queries: Complex SQL queries were optimized to improve performance, ensuring that both historical data analysis and forecasting could be conducted in real time without significant delays.
- Data Partitioning: Datasets were partitioned based on time or other key attributes, which helped to streamline the querying process and improve query performance across massive datasets.
4. Integration Across Tools
- Seamless Data Integration: The integration between BigQuery and Power BI was achieved using connectors, allowing for seamless data extraction, transformation, and loading (ETL) into Power BI. This facilitated real-time updates and ensured that the data presented on the dashboard was always current.
- Data Schema Management: A clear data schema was designed to ensure consistency between datasets and to allow Power BI to properly interpret and visualize data from BigQuery.
- Automated Data Refresh: The integration was configured to automatically refresh the data on a scheduled basis, ensuring that the forecasts and analyses presented in Power BI remained up-to-date.
5. Forecasting Accuracy and Variable Selection
- Feature Engineering: In the process of selecting variables for forecasting, more emphasis was placed on relevant demographic factors (age, gender, marital status) and service types that showed meaningful patterns in the data.
- Segmentation and Aggregation: The forecasting models were refined by segmenting the data into more granular groups (e.g., by age group, marital status) and aggregating trends over different time frequencies (weekly, monthly, yearly). This improved the model’s ability to forecast trends more accurately.
- Exploratory Data Analysis (EDA): A thorough EDA was conducted to better understand the relationships between various variables and trends. This helped refine which variables to include in the forecasting models and how to handle those that didn’t significantly contribute to predictive accuracy.
Project Snapshots
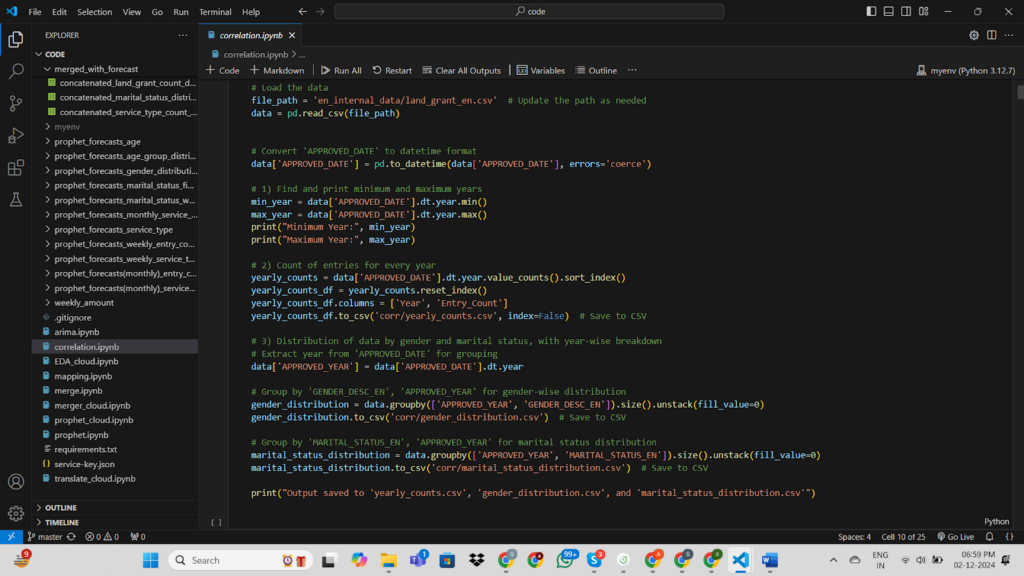
Code
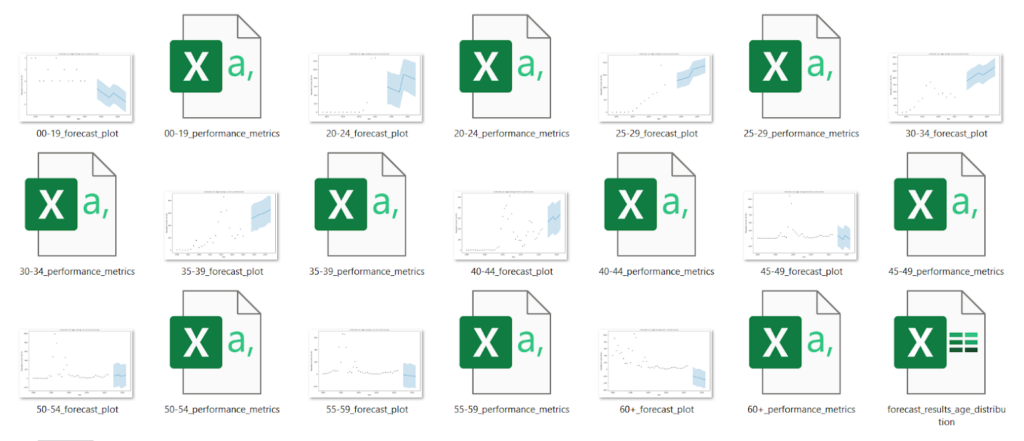
Image 2 Forecasting data in excel sheet and ploting for those forecasting data
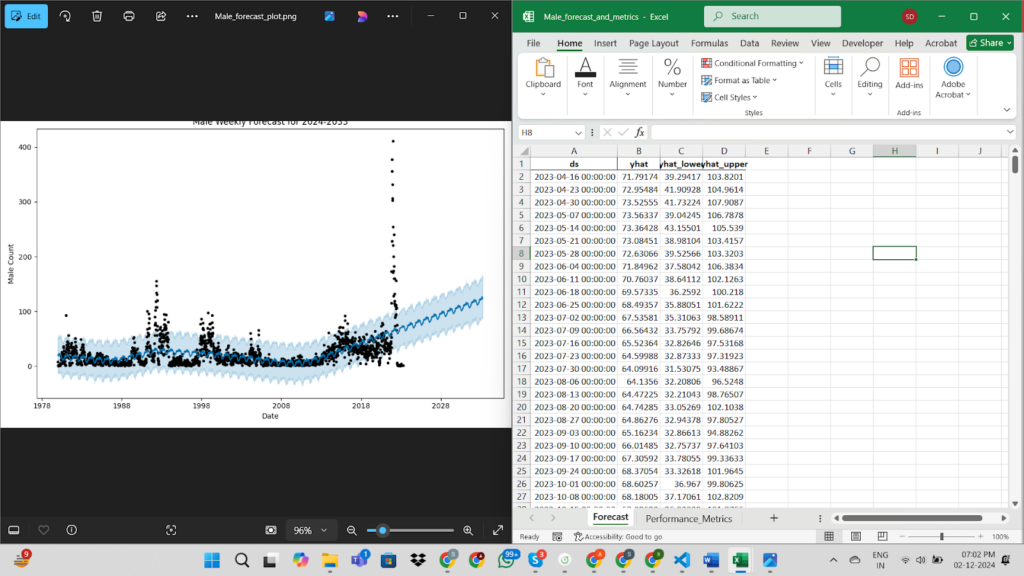
Image 3 forcasting for one of the variable


 Tool using BERT")


 to Data Warehouse to Klipfolio Dashboard")

 to PowerBI")