


Client Background
Client: A leading retail tech firm in the USA
Industry Type: Retail
Products & Services: Retail Businesses
Organization Size: 100+
The Problem
The organization has some services like sales, installs and services for many departments like drain, plumbing, excavation, hvac and bath. Organization wants to track some KPIs based on the given monthly target and tracking should be department wise or technician wise. The dashboard will show tracking the pace of KPIs so that they can understand how the organization is performing in each department in terms of number of jobs, revenue etc and also they want to understand how technicians are working to achieve their monthly target. Dashboard has two basic views – one for admin persons and one for users only. When an admin person logged in to the web app he will see the dashboard as an iframe and he can filter date range, department, technician to see the progress of department and technicians. When a user logged in to the web app he will see the user dashboard view after auto-filtering his name so that he can only view his data in the dashboard.
Scope of this project is limited to AtoZ Dependable Service but scaleable to auto user filter in dashboard datasource. Each user will see his data only in the dashboard that brings data security and integrity.
Our Solution
Define attributes and entities that needed to determine all the KPIs for tracking
Group KPIs in categories and subcategories. For example- as per work defined in organization can be divided into three main categories called Service, Sales and Install. And each of these categories can be divided into 5 departments called- Drain, BATH, HVAC, plumbing and excavation. So any department will have the same KPIs for the same category. You can refer the document – https://drive.google.com/file/d/131epQtbEtvRKFdWkXq86TE35jcNe3Ntx/view?usp=sharing
Determine Calculations for each KPIs
Design Dashboard in looker studio and add components need to track those KPIs and use those KPI calculations in dashboard to get actual and target values
Determine the Admin view and Users view of the dashboard report and create a separate dashboard for users. In admin create three pages Service, Sales and Install. For users create 3 separate dashboard each belongs to one of the main category
Add datasource for each of the main categories- Service, sales and install, assign these datasource to the correct page. Same data source will be reused in users dashboard
Determine what type of charts needed to full fill the client requirement, add them and configure accordingly
Create embedded URL and provide those to the developer team to use as iframe in the primary product www.atozscoreboard.com.
Create a user filter parameter (default- params) for the user dashboard and make this as json string and pass it to the embed url through back-end code. So when a user will log in to the web app they will see a filtered dashboard which will only show his filter data from data source
Deliverables
>> Front-end component –
- Login page
- Signup Page
- Change password
- Homepage (Login User) – User Dashboard
- Homepage (Admin) – Admin Dashboard
- Add Actual forms – Install Actual, Sales Actual, Service Actual
- Add Target forms – Install Target, Sales Target, Service Target
- List View – Install Actual, Sales Actual, Service Actual
- List View – Install Target, Sales Target, Service Target
>> Back-end components (in main/views.py)
- Login View
- Signup View
- Change Password View
- Reset Password By Email View (Email service needed)
- Install CreateView (UpdateView DeleteView implemented but not used)
- Sales CreateView (UpdateView DeleteView implemented but not used)
- Service CreateView (UpdateView DeleteView implemented but not used)
- Install Target CreateView Updateview DeleteView
- SalesTarget CreateView Updateview DeleteView
- ServiceTarget CreateView Updateview DeleteView
- STATIC_FOLDER in VM = ‘/demo/www/public/web_app’
Tech Stack
- Tools used
- Django3.2, LookerStudio
- Language/techniques used
- Python, Html5, CSS, Jquery, Bootstrap4
- Skills used
- Data visualisation, Database Optimized Queries, Form Validations, Tracking Algorithms
- Databases used
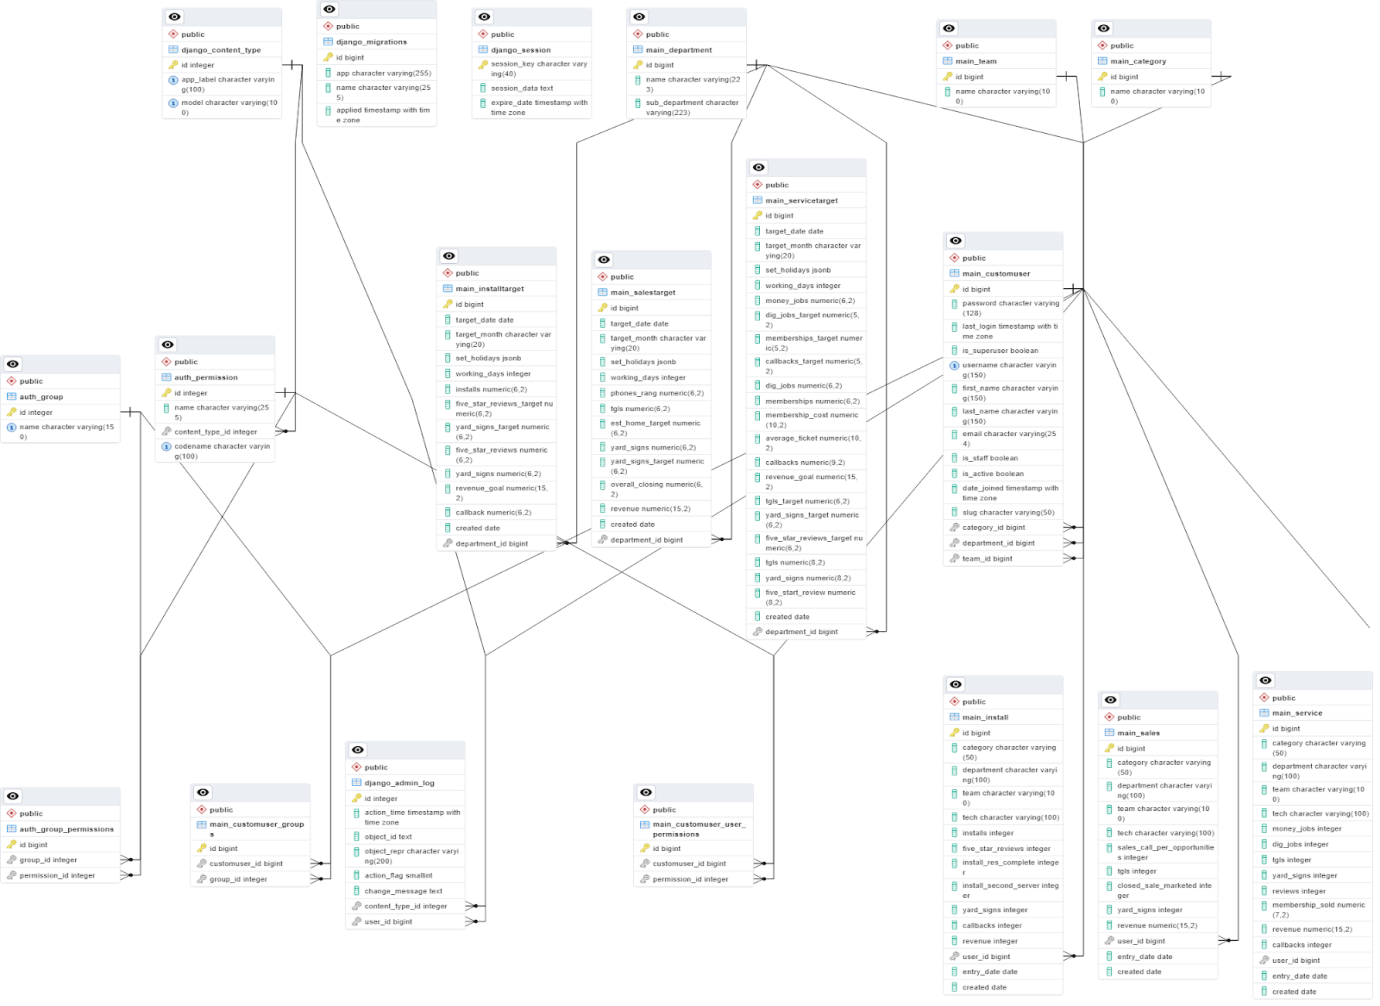
- PostgreSQL
- Web Cloud Servers used
- Linode VM
What are the technical Challenges Faced during Project Execution
Admin Dashboard:
- Overview: Provides an overall view of the monthly performance of all departments.
- Tracking: Allows admins to track the progress and performance of individual employees within each department.
- Analytics: Offers detailed analytics and reports on departmental and employee performance metrics.
Employee Dashboard:
- Goals and Targets: Displays specific goals and targets for employees to achieve.
- Performance Tracking: Enables employees to monitor their progress towards their goals.
How the Technical Challenges were Solved
Dashboard has two basic views – one for admin persons and one for users only. When an admin person logged in to the web app he will see the dashboard as an iframe and he can filter date range, department, technician to see the progress of department and technicians. When a user logged in to the web app he will see the user dashboard view after auto-filtering his name so that he can only view his data in the dashboard.
Scope of this project is limited to AtoZ Dependable Service but scaleable to auto user filter in dashboard datasource. Each user will see his data only in the dashboard that brings data security and integrity.
To add Actual Data User can add data in actual form of their assigned category. And only Admin can add actual entry of any user. Also Admin can Add and view targets of install, Sales and Service. After adding month targets, Users can see their targets and user can track their own performance and Admin can track all users performance.
Business Impact
Implementing a comprehensive tracking system with both an admin dashboard and an employee dashboard will have significant positive impacts on the business, including:
- Enhanced Performance Management:
- Improved Oversight: Admins can easily monitor departmental and individual performance, ensuring that goals are met and identifying areas for improvement.
- Data-Driven Decisions: Access to detailed analytics enables informed decision-making, allowing for timely interventions and resource allocation.
- Increased Employee Accountability:
- Clear Objectives: Employees have a clear understanding of their goals and targets, fostering a sense of responsibility and ownership over their work.
- Real-Time Feedback: Continuous tracking and feedback help employees stay on track and make necessary adjustments to meet their objectives.
- Boosted Productivity:
- Motivation: Transparent performance metrics and progress tracking motivate employees to perform at their best.
- Goal Alignment: Ensures that individual goals are aligned with departmental and organizational objectives, driving overall productivity.
- Enhanced Communication and Transparency:
- Open Communication: Facilitates open communication between management and employees regarding performance expectations and achievements.
- Transparency: Promotes a culture of transparency, where employees are aware of how their contributions impact the organization’s success.
- Operational Efficiency:
- Streamlined Processes: Reduces the administrative burden of performance tracking, freeing up time for more strategic activities.
- Proactive Management: Enables proactive management of performance issues before they escalate, maintaining high levels of operational efficiency.
Overall, the implementation of this tracking system will lead to a more motivated and productive workforce, better alignment of individual and organizational goals, and ultimately, enhanced business performance and growth.
Project Snapshots
Project website url
AtoZDashboard Web App – atozscoreboard.com
AtoZDashboard-Admin – https://www.atozscoreboard.com/admin/
AtoZDashboard-Admin – https://lookerstudio.google.com/reporting/1cbee37f-4b0f-44dc-b8a3-3a7bc2fce6ad
AtoZDashboard-Install_User – https://lookerstudio.google.com/reporting/c7158228-9aec-49d7-9ade-c10e5b96930f
AtoZDashboard-Sales_User – https://lookerstudio.google.com/reporting/edd0ca07-e841-471a-af1d-e9c9d4429ae2
AtoZDashboard-Service_User – https://lookerstudio.google.com/reporting/e281ee62-bb6b-454f-9f30-b6b839f7c081
Summarize
Summarized: https://blackcoffer.com/
This project was done by the Blackcoffer Team, a Global IT Consulting firm.
Contact Details
This solution was designed and developed by Blackcoffer Team
Here are my contact details:
Firm Name: Blackcoffer Pvt. Ltd.
Firm Website: www.blackcoffer.com
Firm Address: 4/2, E-Extension, Shaym Vihar Phase 1, New Delhi 110043
Email: ajay@blackcoffer.com
Skype: asbidyarthy
WhatsApp: +91 9717367468
Telegram: @asbidyarthy

")


