

Client Background
Client: A leading healthcare tech firm in the USA
Industry Type: Healthcare
Services: Healthcare solutions, healthcare services
Organization Size: 100+
Objective
Objective of project to predict number of conversions per day and understand the effectiveness of marketing channels as well as other internal/external factors.
Project Description
The project is based on the marketing mix data analysis to predict the number of conversions per day using different spending channels. There are 11 spending channels, 1 promotions column,2 internal factors column and a date column. We have done exploratory data analysis and created multiple models using different machine learning algorithms.
Our Solution
We have done some Exploratory data Analysis on the data after that we have applied some feature engineering to remove outliers and scaling the data and created different models using different machine learning algorithms and compared them to find best model.
Exploratory Data Analysis
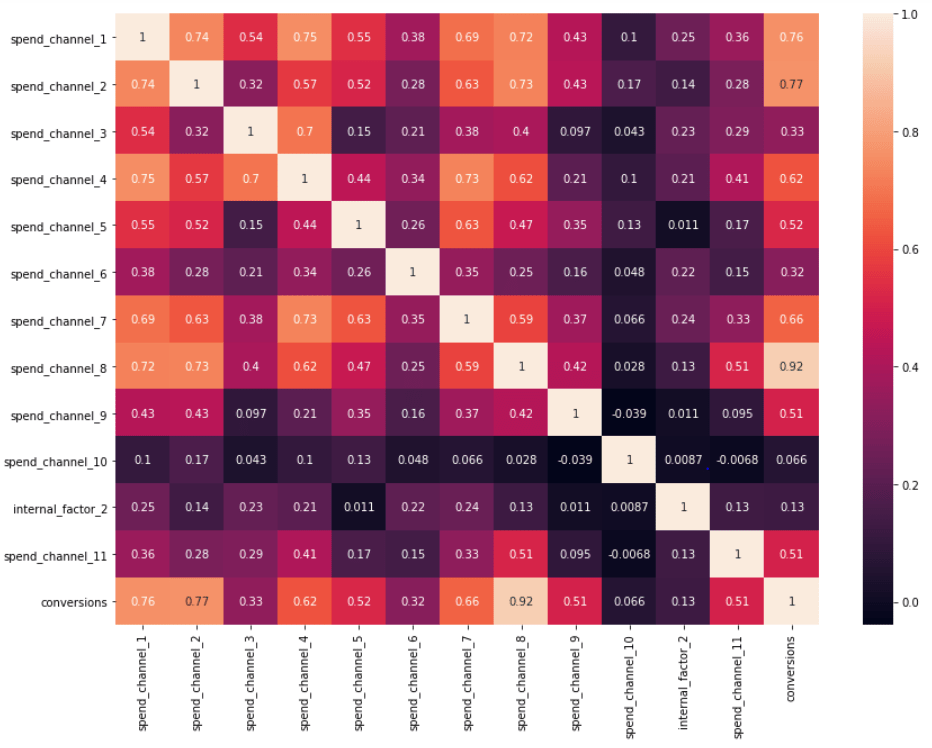
- Correlation Heatmap
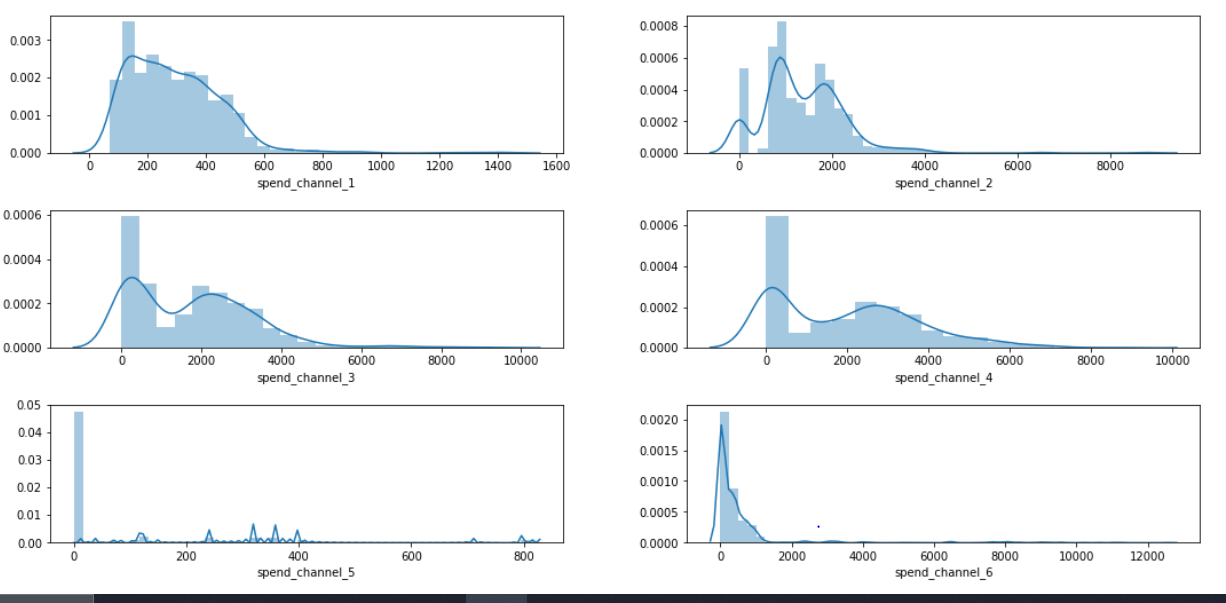
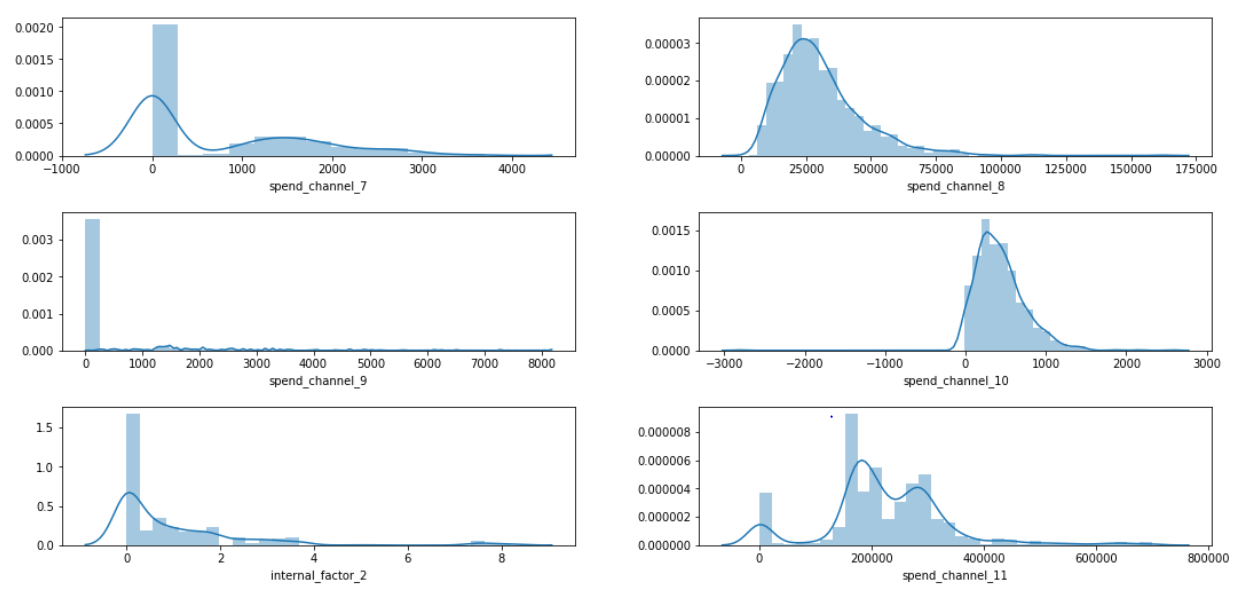
- Distribution Plot
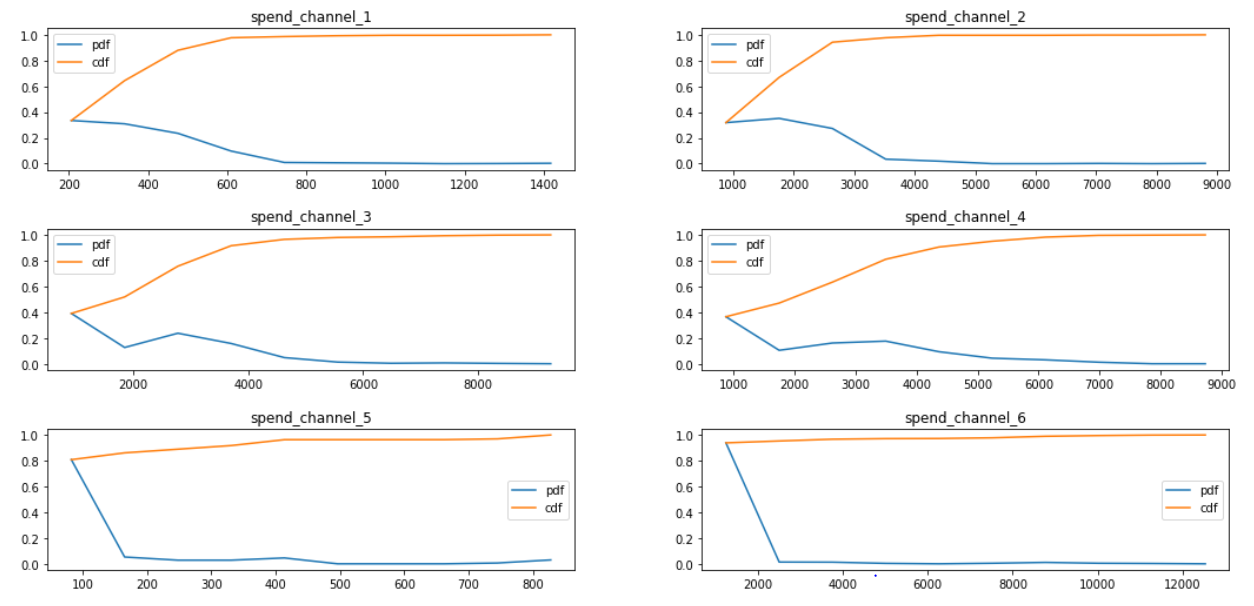
- Probability Density function (PDF) and Cumulative Density Function(CDF)
- Box Plot
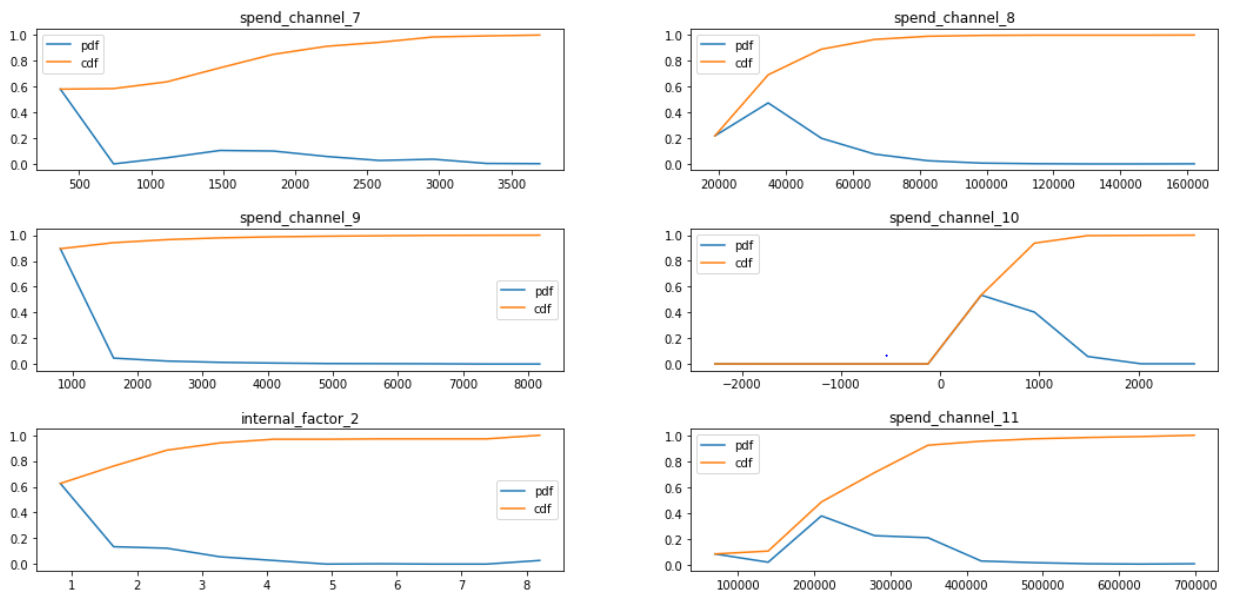
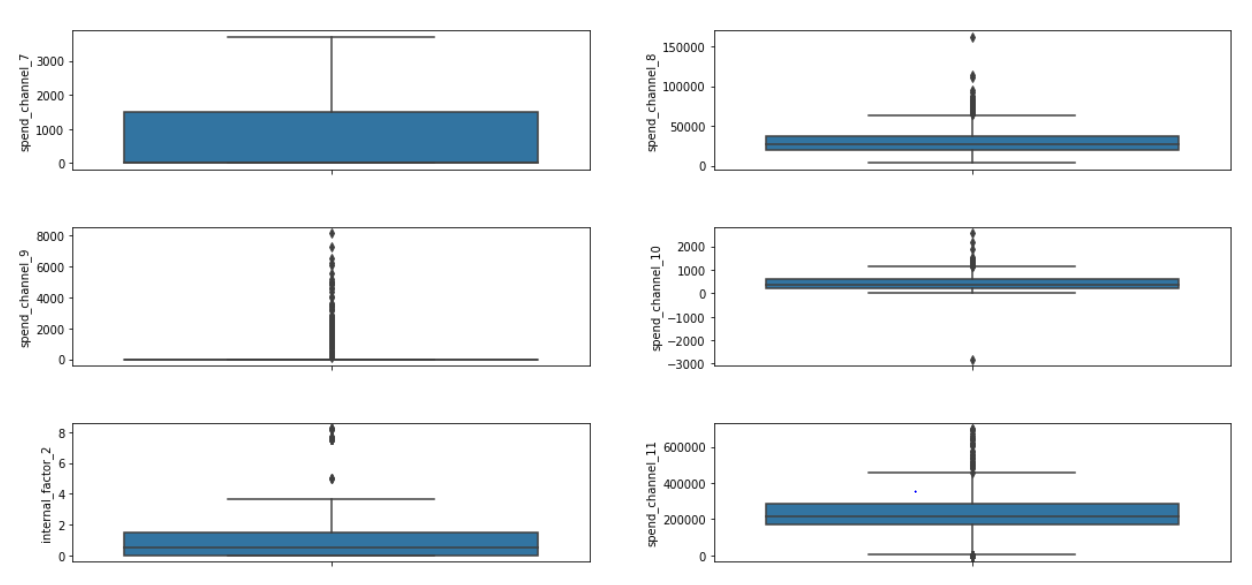
Observations
- Target conversions shows a very high correlation with spend_channel_8, spend_channel_1, spend_channel_2
- We can see that feature spend_channel_5, spend_channel_7, spend_channel_9 have most of the values is equal to zero or close to zero
- Data is very skewed and have very high variance and contains outliers.
Feature Engineering
- Added more features
We have extracted day and day of week features from the date. It can be useful since it is possible that spending is more on weekdays or end of the month.
- Removed Outliers
From the above analysis we can clearly see the presence of outliers in the data. Since data is not normally distributed so we have used IQR to remove the outliers.
- Standard Scaling
Since we can see that there are few features have 6 digit values and few have only one digit. So we are scaling using Standard scaler. It will improve model performance.
Project Deliverables
- Project Report
- Excel Sheet Containing statistical information, Model results and insights about features.
- IPython Notebook
Tools used
- Numpy
- Pandas
- Matplotlib
- Seaborn
- Scikit-Learn
- Scipy
Language
Python3
Models used
- Linear Regression
- Decision Tree
- Random Forest
- Support Vector Regressor
- Gradient Boosting
- XGBoost
Model Results
| Model | Mean Absolute Error (MAE) | Mean Squared Error (MSE) | Root Mean Squared Error (RMSE) |
| Linear Regression | 40.41 | 3596.90 | 59.98 |
| Decision Tree | 52.53 | 7292.99 | 85.40 |
| Random Forest | 42.36 | 5997.77 | 77.44 |
| Support Vector Regressor | 128.96 | 45117.46 | 212.41 |
| Gradient Boosting | 38.54 | 4009.48 | 63.32 |
| XGBoost | 36.50 | 4123.71 | 64.22 |