

Working at the office customizing and installing different content management systems (CMS) for some of our clients, I have seen different ways of tracking users and then using the collected data to:
- generate analytics reports
- personalize content
I am not talking about simple Google Analytics data. I am referring to ways to map users into predefined personas and then modify the content of the site based on what that person is interested in.
Recently, I grew interested in graph databases – in particular, Neo4J Graph Database – and since it’s quite simple to create a graph that maps the structure of a website (i.e. the website sitemap), I began to think that there might be a way to employ the power of graph DBs to:
- track users more efficiently
- use the collected data to generate better analytics reports
- get better real-time content personalization
- be able to efficiently answers questions that would have been hard to answer using regular tracking mechanisms
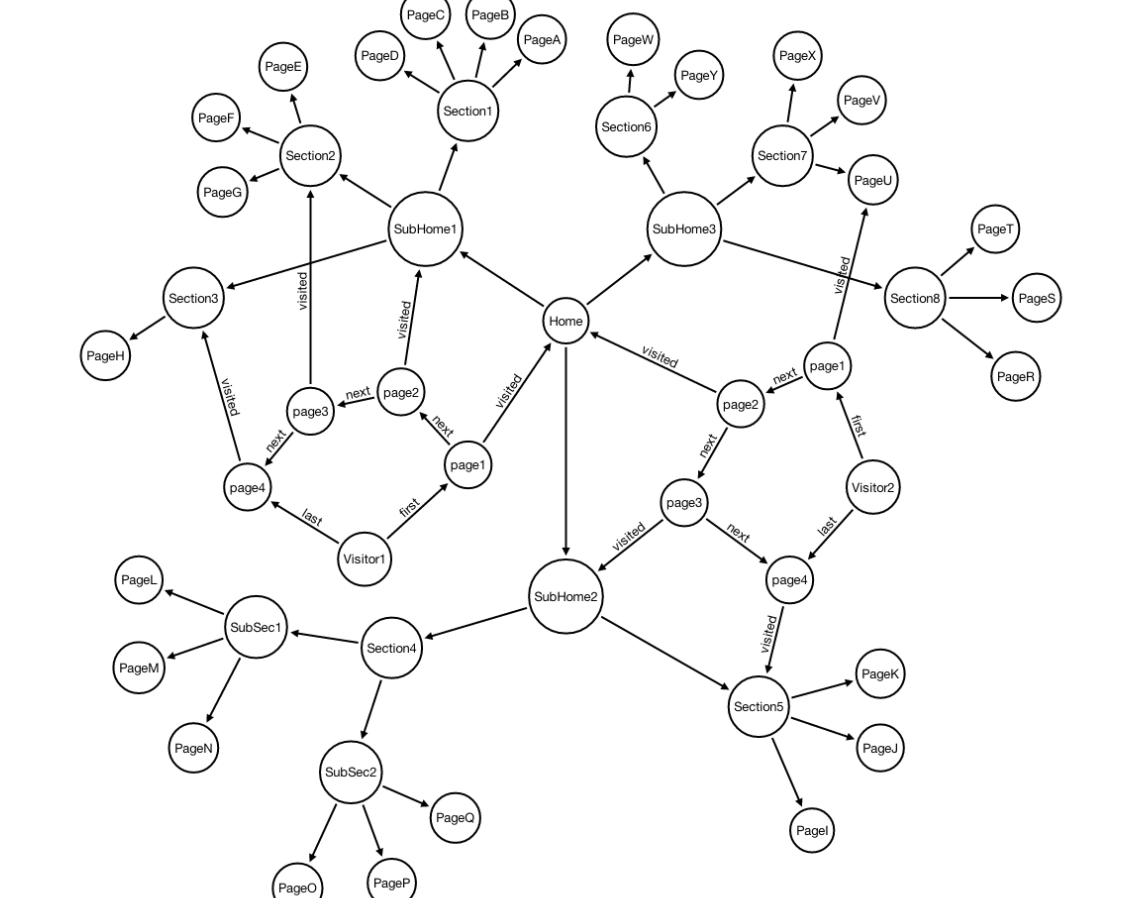
This morning, while I was having breakfast, I started brainstorming possible ways to use Neo4J Graph Database to track users. My first obvious ideas were to simply connect each user to all the pages they had visited:
An interesting starting point which I immediately redraw adding the concept of time tracking in each visit, by connecting visited pages in a sequence using a linked list:
Next, before going to the office, I posted these two sketches on Twitter asking for some feedback. Lots of people interested in graph databases (and Neo4J) were immediately interested.
Among them, @kennybastani suggested to “think of each visit as an event node” in order to “preserve the continuity of paths“. This is my interpretation of his suggestion:
At this point, we realized that the 140 characters limit imposed by Twitter would get in the way of an interesting discussion and we decided to turn this brainstorming session into a blog post to give everyone a chance to participate.
Personas
A persona is a group of visitors that visit a website, that share a common objective, purpose or background which make them distinct from another group of visitors.
Understanding in real-time, as the visitor browses a site, what is the purpose of his visit, can help to tailor the content displayed in the sidebars to better appeal to his/her interests.
Each page of the site can be assigned a value for each of the different personas identified as the most likely types of visitors for the site at hand. Here is my try to add this concept to the previous graph:
In order to better understand the idea behind this, let’s take a concrete example: an animal rescue shelter. Some visitors will come to the site to look to volunteer; others will want to understand how to fundraise. Others are looking to adopt either a cat or a dog. Some are coming to donate money to the shelter.
The following graph takes into account all the above personas and shows some possible values assigned to certain pages.
By the time the user gets to the Puppies: Page, he/she has already accumulated from the previous pages:
- 12 points as a person that wants to adopt
- 4 points as a dogs lover
- 2 points as a possible donor
therefore in the sidebars of the Puppies: Page we should show some Calls To Action (CTAs) to donate money to the shelter using images of dog puppies. “Duh — you might say — the person is on the Dogs/Puppies page, so obviously you will show such a CTA!” That’s true… but let’s imagine that, after visiting Lucy: Page, that the visitor goes back to the homepage. By this time he/she has accumulated:
- 26 points as a person that wants to adopt
- 20 points as a dogs lover
- 2 points as a possible donor
Guess what should be shown big on the homepage?
- At the top I would show a large CTA inviting the visitor to donate, using the image of a puppy dog (because the user is a dog lover).
- In the sidebars, I would place a few CTAs inviting the user to adopt some of the dogs that have been at the shelter for the longest time (because the user is interested in adopting).
- Most of the articles featured on the home page should be happy stories about dogs who were adopted and now live happy life with their new families.
Value of using Neo4J Graph Database
Everything I said so far can be accomplished with relational databases. The main concern there is the size of the database (tracking databases tend to become large quickly and this obviously can deter real-time performance).
The question that remains on the table is whether graphs can bring value to this scenario either by:
- providing faster feedback to the content management engine
- allowing to do better offline reporting
- allowing to answer questions that would be difficult to answer with a traditional relational database
Source: https://1000linesofcode.wordpress.com/2014/01/22/using-neo4j-for-website-analytics/


 in the Indian economy")
